Introduction
Influenza is a communicable disease primarily caused by influenza A or B viruses. It is a common acute respiratory illness that tends to spread during the winter season in Korea. Transmission occurs through respiratory droplets emitted from infected subjects. The basic reproduction number, which is defined as the average number of secondary cases per case in a totally susceptible population, has been observed to range from 1.27 to 1.8 in the four pandemics since the 20th century and during seasonal influenza epidemics [1]. Influenza poses a high risk of complications and can result in serious clinical outcomes in vulnerable populations, such as those aged 65 and above, children, and people with chronic diseases. It also increases absenteeism rates at workplaces and schools, and rapidly increases the demand for medical care, significantly impacting society from a public health perspective.
Influenza surveillance involves collecting data on influenza transmission trends and circulating virus types to predict the timing and intensity of epidemics. Surveillance helps maintain an appropriate level of preparedness, with the goal of minimizing the socioeconomic impact during the influenza season. In Korea, surveillance measures include monitoring outpatient illness, hospitalizations, and virological factors to determine the onset and end of epidemics, analyze their progression, and manage seasonal influenza based on pathogen characteristics. Outpatient illness surveillance is carried out at approximately 200 sentinel sites nationwide as of October 2023, with 87 of these sites also participating in virological surveillance. Additionally, influenza hospitalizations and deaths are surveilled at secondary and tertiary hospitals to monitor the severity of seasonal influenza [2].
In Korea and the United States (U.S.), influenza surveillance among outpatients collects information on influenza-like illness (ILI). The proportion of visits with ILI among all outpatient visits is estimated and used as a monitoring tool for influenza surveillance [2,3]. While the case definition of ILI varies across countries and agencies, it generally consists of fever and respiratory infection symptoms. Since ILI is a common clinical presentation of various respiratory infections, it is used as a surrogate indicator for tracking influenza epidemics even though it does not accurately estimate the incidence of influenza [4,5]. The positivity rate of respiratory specimens for influenza viruses is also used as a monitoring indicator, with the European Centre for Disease Prevention and Control (ECDC) defining the start and end of influenza epidemics based on a 10% positivity rate in respiratory samples collected from sentinel sites [6].
In Korea, unlike the U.S. and Europe, an influenza alert that was issued in the 37th week of 2022 has been in effect for 69 consecutive weeks as of December 2023 [7]. This is the first occurrence of such a phenomenon since the establishment of the influenza surveillance system in Korea in 2000. It also deviates from the well-known epidemiological characteristic that influenza typically spreads in the winter season in temperate regions [8–10]. Therefore, a rigorous assessment is necessary to determine whether this phenomenon can be interpreted as reflecting an actual prolonged increase in influenza activity.
This study aimed to compare the duration of seasonal influenza epidemics calculated using different influenza epidemic thresholds used in Korea, the U.S., and Europe. The implications of the study findings will be discussed in the context of the ongoing influenza epidemic in Korea that has lasted since 2022.
Methods
This study was based on public data. Neither approval by the institutional review board nor obtainment of informed consent was required.
The epidemic periods for the three most recent seasons (2018–2019, 2019–2020, 2022–2023) were analyzed, excluding the two seasons (2020–2021, 2021–2022) that did not experience influenza epidemics. This analysis applied the epidemic thresholds established by Korea, the U.S., and Europe.
National influenza surveillance data in Korea were collected from the weekly reports published by the Korea Disease Control and Prevention Agency (KDCA) [11]. Weekly data on ILI rates, the number of respiratory specimens, and the number of influenza-positive specimens from the 36th week of 2015 to the 35th week of 2023 were used. In Korea, ILI is defined as the presence of fever of 38℃ or higher and respiratory infection symptoms, such as cough and sore throat. Accordingly, this study applied the Korean ILI definition to data to estimate the epidemic threshold for Korea using the Korean and the U.S. methods [2]. Data from the 2020–2021 and 2021–2022 seasons were excluded from the analysis, as there was no influenza outbreak during these seasons. The influenza season was defined as the period from the 36th week of each year to the 35th week of the following year. Each week was defined as starting on Sunday and ending on Saturday. For a week that spanned two years, the week number was assigned based on the year in which the Sunday fell.
The influenza epidemic thresholds from the KDCA, the U.S. Centers for Disease Control and Prevention (CDC), and the ECDC were chosen for a comparative analysis. Korea and the U.S. use the sum of the mean and two standard deviations of weekly ILI rates from non-influenza time periods as the epidemic threshold. In Korea, data from the past 3 seasons are used for the calculation, whereas data from the past 2 seasons are used in the U.S. [2,3]. Europe, in contrast, uses a 10% influenza positivity rate in respiratory specimens as the epidemic threshold (Table 1) [6]. For the Korean and U.S. methods, the earlier of two consecutive weeks when the weekly ILI rate exceeds the epidemic threshold is defined as the start of the influenza epidemic, and the week prior to two consecutive weeks when the weekly ILI rate does not reach the epidemic threshold is defined as the end of the epidemic. In the European method, the epidemic period is determined based on the 10% influenza positivity rate.
Results
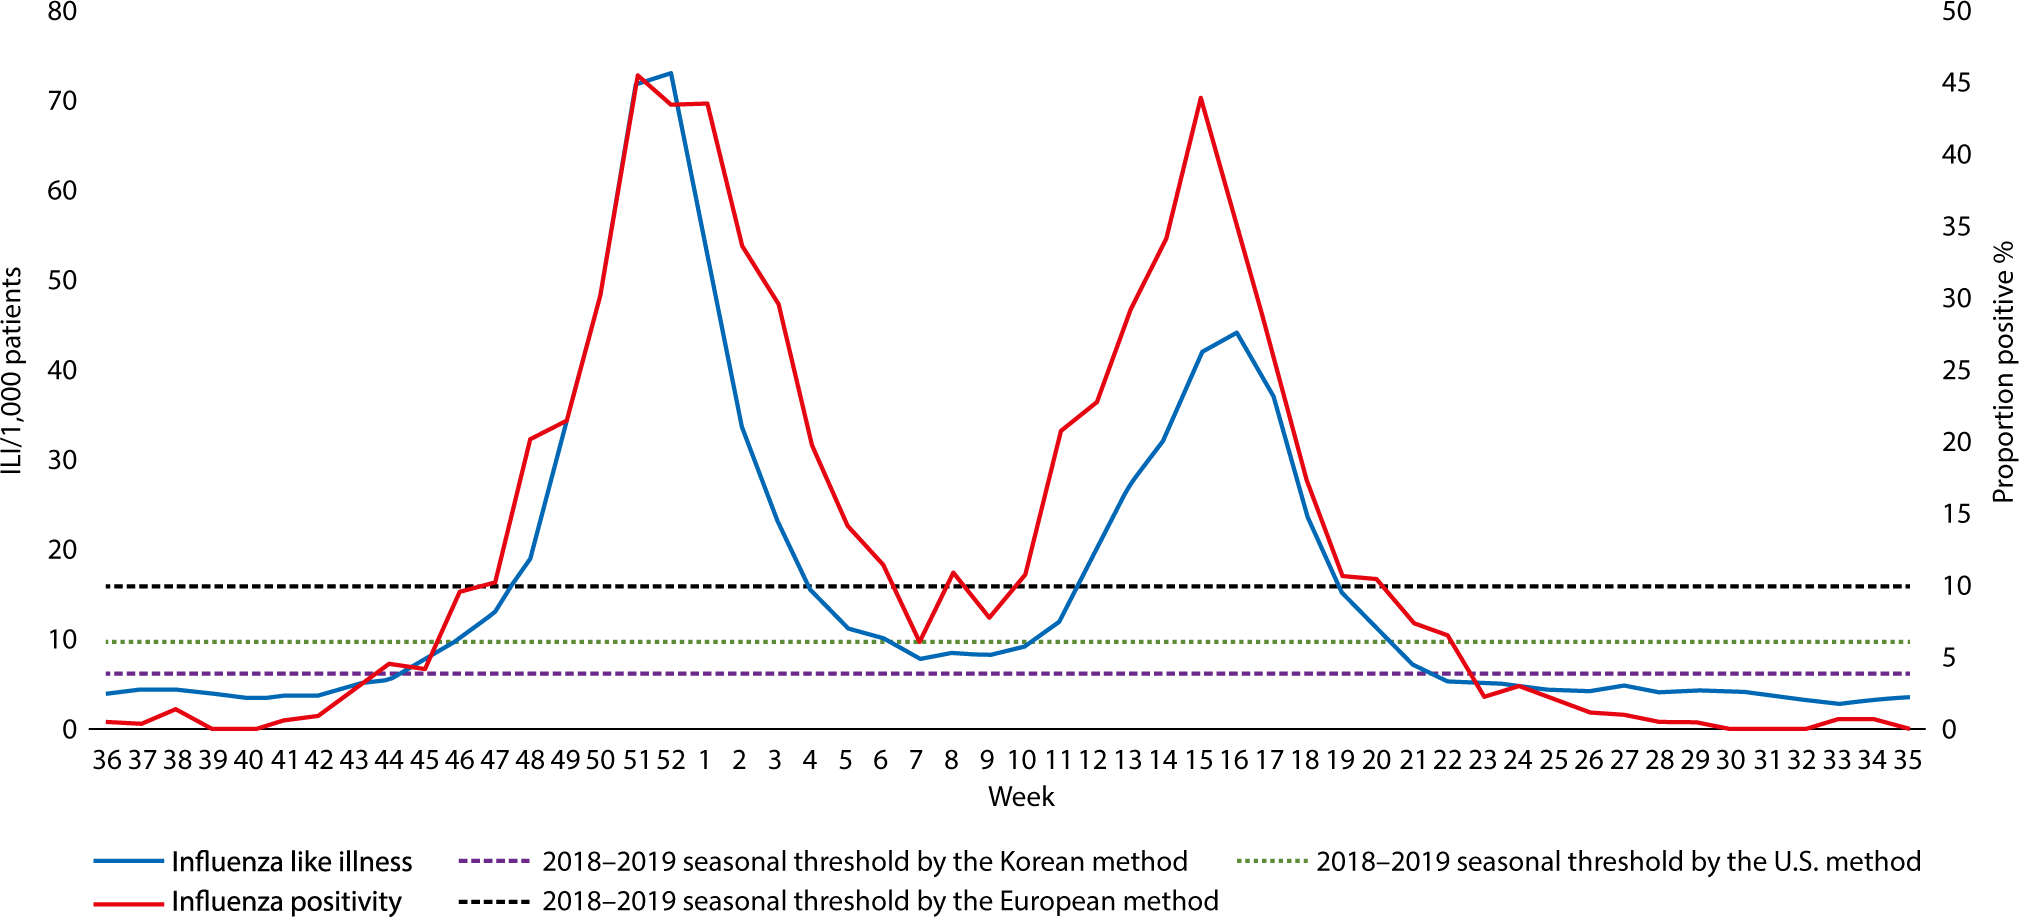
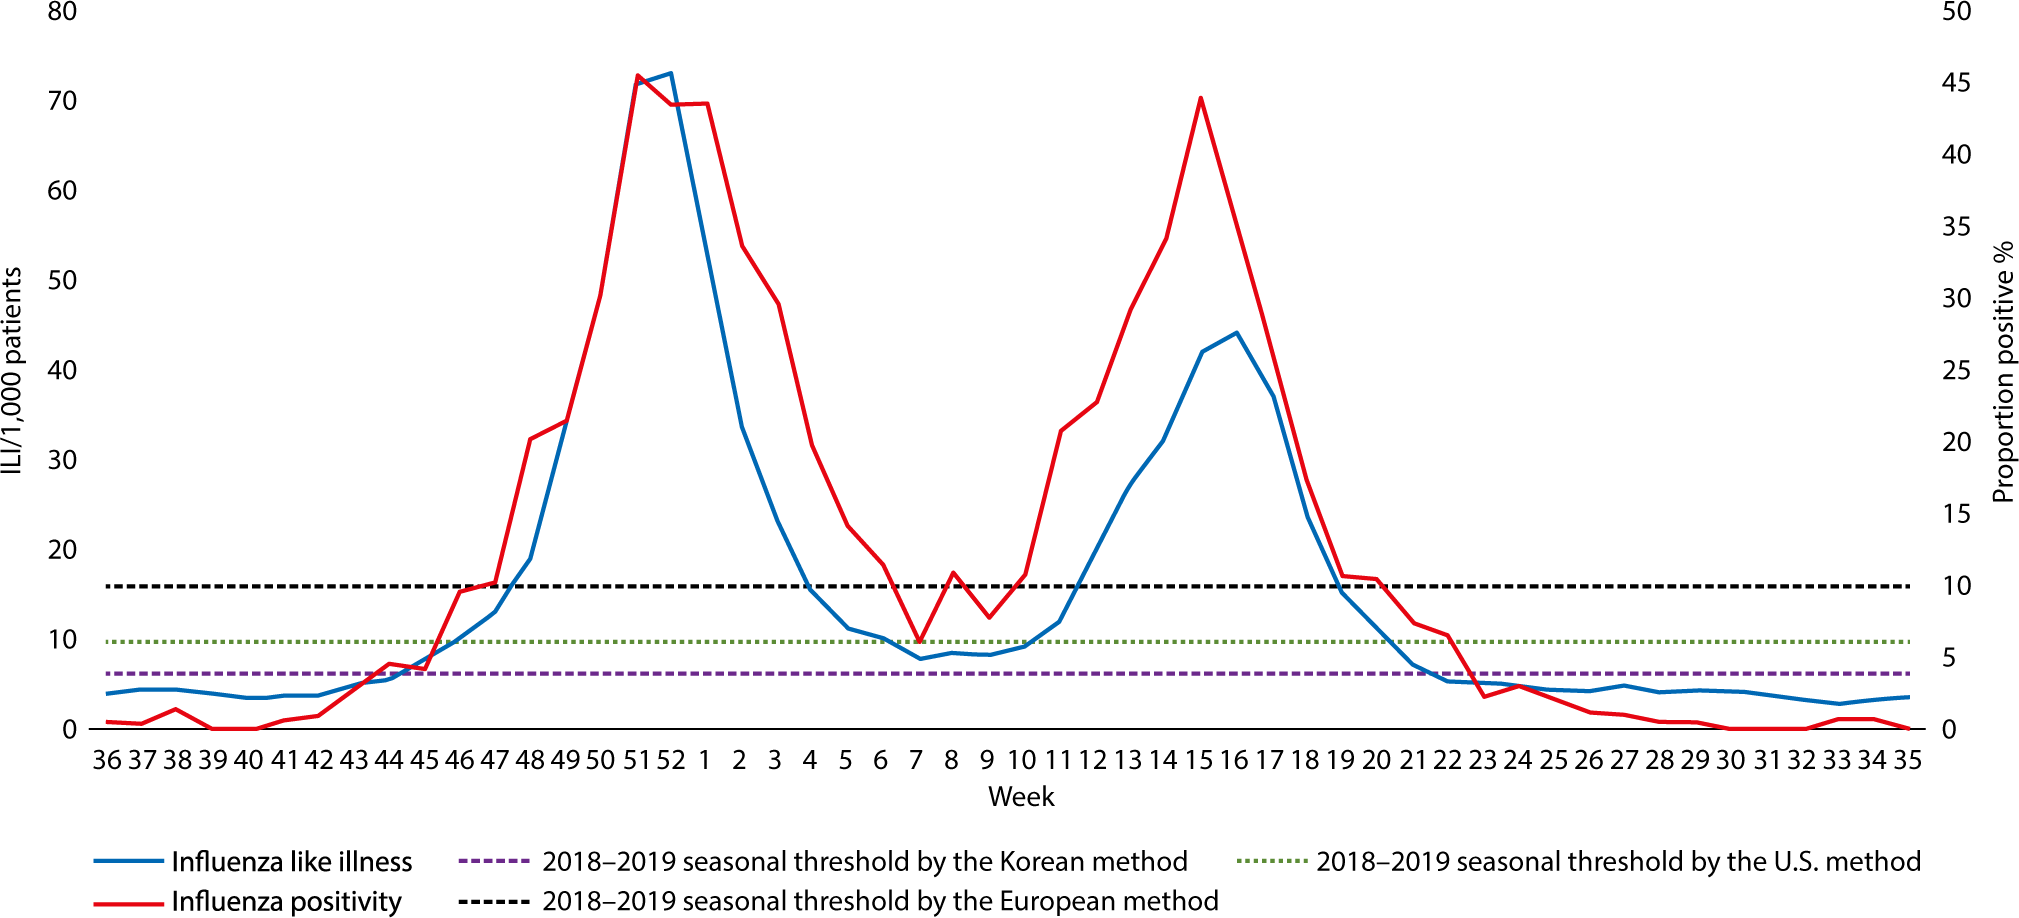
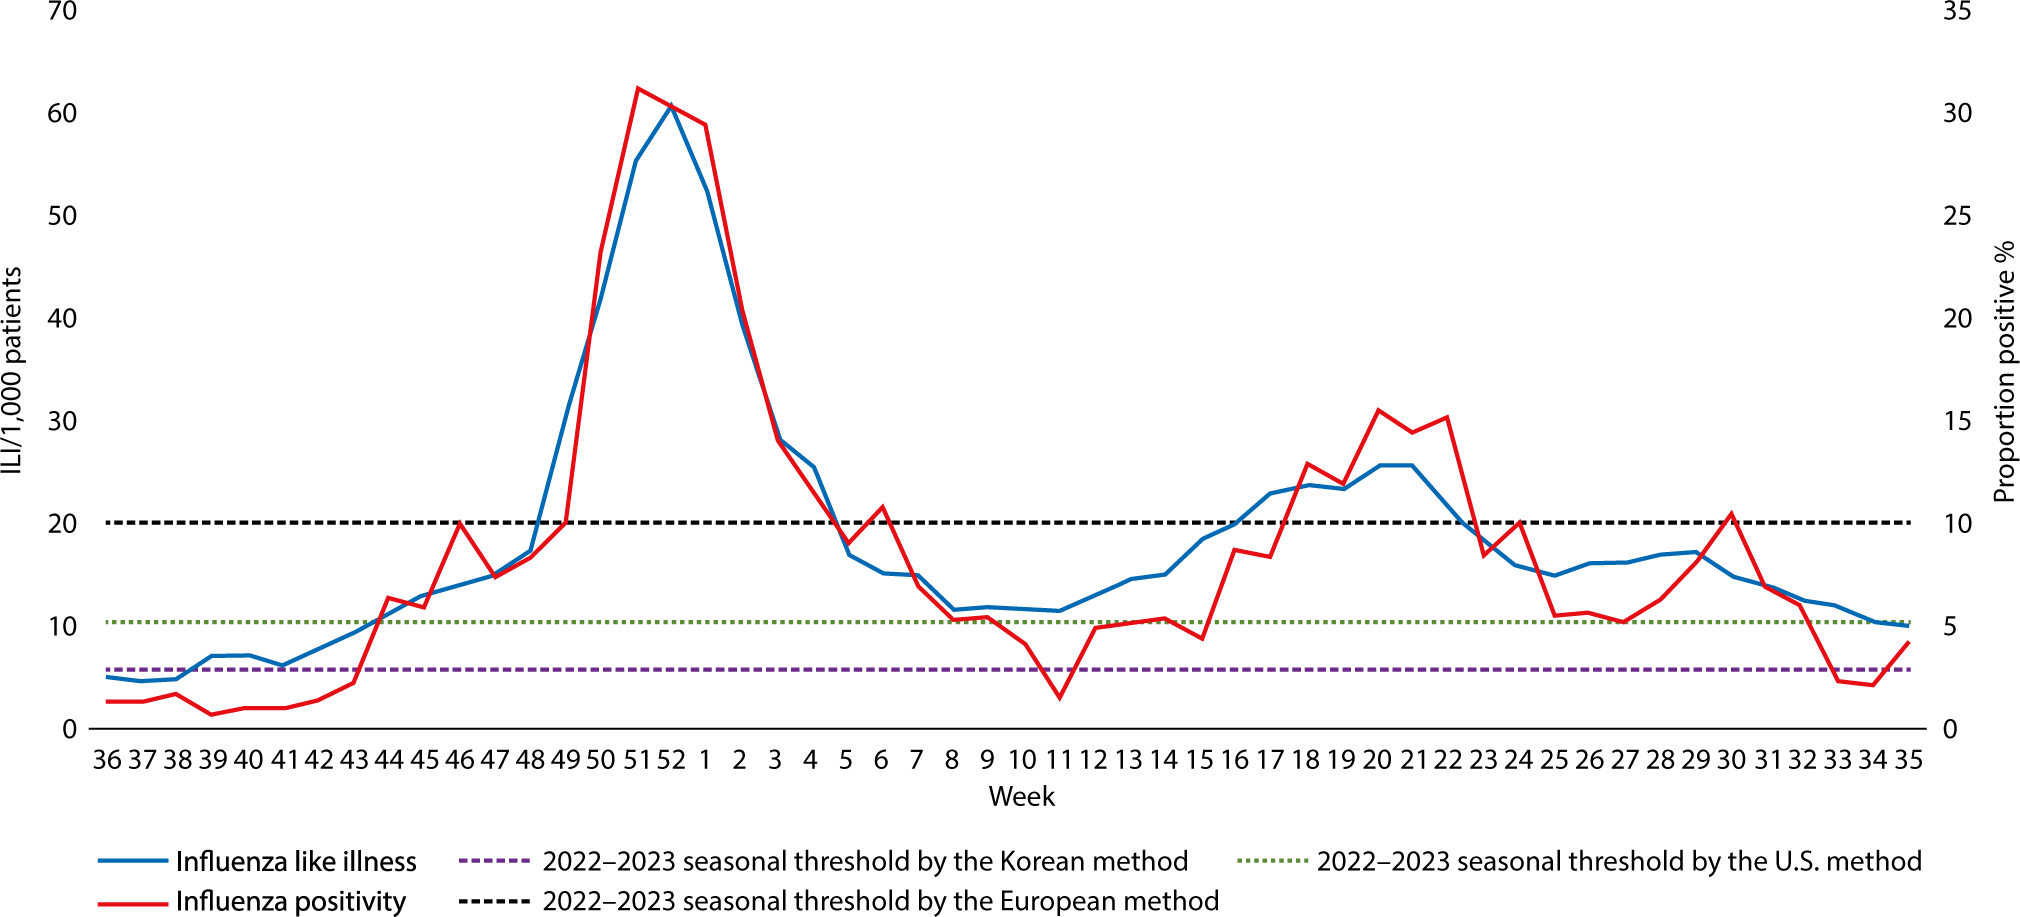
In total, 312 weeks of data from six influenza seasons were collected from the KDCA's weekly reports. Despite using the same influenza surveillance data, differences were observed in the epidemic thresholds and the durations of epidemics depending on the applied method. In the 2018–2019 season, two influenza epidemic peaks were observed (Fig. 1, Dataset 1), and in the 2019–2020 season, the epidemic ended early due to the measures taken in response to the emergence of severe acute respiratory syndrome coronavirus 2 (SARS-CoV-2), with no spring outbreak observed (Fig. 2, Dataset 2). In the 2022–2023 season, elevated ILI rates were observed in general (Fig. 3, Dataset 3).
To calculate the epidemic threshold, the Korean method used ILI rates from non-influenza periods in 156 weeks of the past 3 matching seasons, while the U.S. method used ILI rates from non-influenza periods in 104 weeks of the past 2 matching seasons. For the Korean method, the non-influenza period for the epidemic threshold calculations for the 2018–2019, 2019–2020, and 2022–2023 seasons comprised an average of 70.7 weeks (45.3%), while the non-influenza period for the same seasons using the U.S. method was an average of 74.7 weeks (71.8%). Since the non-influenza period defined by the Korean method was shorter, lower ILI rates were used in the epidemic threshold calculation than with the U.S. method. Accordingly, the mean and SD values derived from the ILI rates for the non-influenza time periods used in the Korean method were lower than those for the U.S. method (Table 2).
The influenza epidemic thresholds estimated using the Korean method were 6.3 ILI cases per 1,000 patients (2018–2019 season), 6.0 ILI cases per 1,000 patients (2019–2020 season), 5.8 ILI cases per 1,000 patients (2022–2023 season), and 6.3 ILI cases per 1,000 patients (2023–2024 season). The thresholds calculated using the U.S. method were 9.7 ILI cases per 1,000 patients (2018–2019 season), 11.1 ILI cases per 1,000 patients (2019–2020 season), 10.5 ILI cases per 1,000 patients (2022–2023 season), and 18.7 ILI cases per 1,000 patients (2023–2024 season). The Korean method yielded lower epidemic thresholds than the U.S. method in all seasons. The largest difference was observed for the 2023–2024 season, which reflected the 2022–2023 season data during the COVID-19 pandemic (Table 3).
The estimated duration of the epidemic period using the Korean threshold was longer than those calculated with the U.S. and European thresholds in all seasons. The durations based on the Korean thresholds were 29 weeks (2018–2019 season), 17 weeks (2019–2020 season), and 49 weeks (2022–2023 season). In contrast, the durations based on the U.S. thresholds were 23 weeks (2018–2019 season), 12 weeks (2019–2020 season), and 43 weeks (2022–2023 season). Durations calculated with the European thresholds were the shortest, at 24 weeks (2018–2019 season), 13 weeks (2019–2020 season), and 16 weeks (2022–2023 season; Table 4). The mean epidemic duration for three seasons based on the Korean thresholds was 5.7 weeks (22%) longer per season compared to that calculated using the U.S. method, and 14 weeks (79%) longer compared to that calculated using the European method. The difference was particularly prominent in the 2022–2023 season, where the duration based on the Korean thresholds was 33 weeks longer than that based on the European threshold.
Discussion
This study compared the influenza epidemic periods in Korea during the 2018–2019, 2019–2020, and 2022–2023 seasons, utilizing epidemic thresholds from Korea, the U.S., and Europe. The influenza epidemic threshold calculated with the Korean method was approximately 49% lower than that calculated using the U.S. method. Additionally, the epidemic durations based on the Korean thresholds were longer than those based on the U.S. and European thresholds.
The differences in epidemic thresholds between the Korean and the U.S. methods primarily stemmed from the different definitions of the non-influenza time period in both countries. In Korea, this period is defined as when the weekly influenza positivity rate falls below 2%, a figure that is influenced by the activity levels of other respiratory viruses. In contrast, the U.S. defines the non-influenza period as the time when the number of weekly influenza-positive specimens is less than 2% of the season's total count of influenza-positive specimens, a measure that remains unaffected by the activity of other respiratory viruses. It is important to note that the 2% influenza positivity rate used in Korea's definition of the non-influenza period is significantly lower than the European epidemic threshold of 10%. This discrepancy results in the use of lower ILI rates from periods of relatively low influenza activity to calculate the Korean epidemic threshold. Consequently, this could lead to the earlier issuance and later lifting of influenza epidemic alerts.
The largest difference between the epidemic durations determined by ILI rate-oriented thresholds and those determined by influenza positivity rate-oriented thresholds was observed in the 2022–2023 season. The epidemic duration based on the Korean method was 49 weeks, which was roughly 3 times longer than the 16-week epidemic duration based on the European threshold. This discrepancy can be partially attributed to changes in the incidence levels of overall respiratory infectious diseases. During the COVID-19 pandemic, the implementation of stringent social distancing measures and enhanced personal hygiene practices led to a reduced incidence of respiratory infections. However, this low incidence began to increase as public health measures were relaxed in the latter half of 2022. Subsequently, a resurgence of various respiratory infections elevated the overall ILI rates, which likely contributed to the extended epidemic period by interacting with the lower epidemic threshold in the 2022–2023 season [12,13].
According to project reports from the Korea Respiratory Virus Integrated Surveillance System, which tests respiratory samples from respiratory infection patients, including cases of ILI, at sentinel sites, the influenza virus detection rates in 2022 and 2023 were 5.5% and 16.1%, respectively. These rates are similar to or lower than the rates of 17% and 14% observed in 2018 and 2019, before the COVID-19 pandemic. In contrast, the detection rates of SARS-CoV-2 in 2022 and 2023 were 9.4% and 9.8%. The detection rates of other respiratory viruses have also increased since 2021 (Table 5) [11,14,15]. This finding is consistent with a report that the first post-pandemic influenza epidemic was not considered unexpected in terms of extent and severity in most countries [16]. Therefore, the increase in ILI rates in the 2022–2023 season is likely due to the increased activity of SARS-CoV-2 and other respiratory viruses, rather than a significant increase in influenza activity.
ILI is a widely used medical concept and a reliable indicator in influenza surveillance [17]. However, since the clinical features of various respiratory infections often overlap, a rise in influenza activity alone may not fully explain the increase in ILI rates. When analyzing a rise in ILI rates, it is crucial to consider all circulating respiratory pathogens collectively, in conjunction with laboratory test results, to determine the extent to which each pathogen contributes to the increase [18]. The ongoing influenza epidemic in Korea since the 37th week of 2022 appears to be a phenomenon resulting from the combination of the lower influenza epidemic threshold in Korea and the overall increase in ILI rates due to the increased activity of SARS-CoV-2 and other respiratory viruses.
The study did not explore the characteristics of each epidemic threshold, such as the sensitivity and specificity of its application. Merely comparing the durations of epidemic periods does not determine which method should be recommended for a specific country. The approach to setting the influenza epidemic threshold should be assessed differently, taking into account each country’s health system capacity and disease burden. In this study, the influenza epidemic thresholds used in the U.S. and Europe were only compared with those in Korea. Additional comparisons with other countries may increase the generalizability of the study findings.
Conclusion
Influenza surveillance systems are designed to minimize the socioeconomic losses caused by influenza epidemics, making the application of an appropriate epidemic threshold crucial. This study noted variations in the duration of the epidemic period based on the threshold applied. A low influenza epidemic threshold may have contributed to the prolonged epidemic period, which was declared in the 37th week of 2022 and continued until the end of 2023 in Korea. The optimal epidemic threshold should be examined from various perspectives, including the evolving epidemiological characteristics of respiratory infectious diseases since the emergence of SARS-CoV-2. Adopting multiple indicators could enable the issuance of more reliable flu alerts and the implementation of more effective countermeasures.


