1Institute for Development and Human Security, Ewha Womans University, Seoul, Korea
2Department of Environmental Medicine, College of Medicine, Ewha Womans University, Seoul, Korea
3Graduate School of International Studies, Ewha Womans University, Seoul, Korea
4Department of Pediatrics, College of Medicine, Ewha Womans University, Seoul, Korea
5Department of Public Administration, Ewha Womans University, Seoul, Korea
6Department of North Korean Studies, Ewha Womans University, Seoul, Korea
7Department of Thoracic and Cardiovascular Surgery, College of Medicine, Ewha Womans University, Seoul, Korea
8Department of Nutrition Science and Food Management, Ewha Womans University, Seoul, Korea
9Graduate Program in System Health Science and Engineering, College of Medicine, Ewha Womans University, Seoul, Korea
10Graduate School of Pharmaceutical Sciences, College of Pharmacy, Ewha Womans University, Seoul, Korea
11Department of Sociology, Ewha Womans University, Seoul, Korea
12Department of Obstetrics and Gynecology, College of Medicine, Ewha Womans University, Seoul, Korea
13Department of Women’s Studies, Ewha Womans University, Seoul, Korea
14College of Nursing, Ewha Womans University, Seoul, Korea
15Institute of Ewha-SCL for Environmental Health (IESEH), College of Medicine, Ewha Womans University, Seoul, Korea
*Corresponding author: Eunhee Ha,
Department of Environmental Medicine, College of Medicine, Graduate Program in
System Health Science and Engineering, Ewha Womans University, 260
Gonghang-daero, Gangseo-gu, Seoul 07804, Korea, Tel: 82-2-6986-6234, Fax:
82-2-6986-7022, E-mail: eunheeha@ewha.ac.kr
*These authors contributed equally to this work.
• Received: June 13, 2022 • Accepted: September 13, 2022
This is an Open-Access article distributed under the terms of the
Creative Commons Attribution Non-Commercial License (http://creativecommons.org/licenses/by-nc/4.0) which permits
unrestricted non-commercial use, distribution, and reproduction in any
medium, provided the original work is properly cited.
To conduct a comparative study of children’s health in South Korea
versus North Korea focusing on air pollution.
Methods:
We used annual mortality rate, prevalence, and environmental indicators data
from the World Bank and World Health Organizations (WHO). Trend analysis of
the two Koreas was conducted to evaluate changes in health status over time.
Spearman’s correlation analysis was used to find out the correlation
between environmental indicators and children’s health status.
Results:
We found a distinct gap in children’s health status between the two
Koreas. While North Korea reported a higher death rate of children than
South Korea, both showed a decreasing trend with the gap narrowing from 2000
to 2017. The prevalence of overweight and obesity increased and that of
thinness decreased in both Koreas. Except PM2.5 exposure, South
Korea reported higher figures in most indicators of air pollutant emissions
(South Korea, mean (SD)=28.3 (2.0); North Korea, mean (SD)=36.5 (2.8),
P-value=0.002).
Conclusion:
This study empirically discovered the gaps and patterns of children’s
health between South Korea and North Korea. North Korean children
experienced more severe health outcomes than children in South Korea. These
findings imply that epigenetic modification caused by environmental
stressors affect children’s health in the two Koreas despite similar
genetic characteristics. Considering the gaps in children’s health
between the two Koreas, more attention and resources need to be directed
towards North Korea because the necessary commodities and services to
improve children’s health are lacking in North Korea.
Children’s health is an important theme in public health since its impact
covers the life-course from childhood to adulthood. Children have a unique
vulnerability to health-related issues and harmful exposures compared to adults
[1,2]. Since young children go through rapid growth and development, their
metabolism is immature and more vulnerable to environmental stressors [2]. Environmental exposures affect
children’s health and create a larger burden of diseases, including
respiratory diseases (e.g., acute lower respiratory infection [ALRI], pneumonia, and
asthma) [1,3,4]. Environmental exposure is
known as an important determinant of health in both developed and developing
countries, although the patterns of exposure vary [3]. Existing literature discusses the effect of environmental exposure
on children’s health, which causes a larger burden of diseases [4]. Previous epidemiological studies have
reported the association between air pollution exposure and mortality in children
under 5 years [5–8]. Health risks caused by air pollution have a great impact in
low- and middle-income countries [3,9]. People in wealthier nations may be healthier
since economic prosperity allows them to spend more on personal health, leading to
better health outcomes [10]. However,
economic development has led to a higher level of environmental pollution which
damages people’s health [11]. We thus
argue that environmental exposure is an important determinant of health.
Another body of literature emphasizes the importance of epigenetic modifications
caused by environmental stressors such as air pollutants, particulate matter, and
metal exposure, thereby affecting children’s health [12–14].
Epigenetic change considers genetics as a factor but puts greater emphasis on
environmental circumstances that modify one’s health [14]. A comparative study of the Republic of Korea (hereafter
referred to as South Korea) and the Democratic People’s Republic of Korea
(hereafter referred to as North Korea) presents a unique opportunity to compare the
effects of a shared genetic background versus epigenetic modifications caused by
environmental stressors [12,13].
There are few empirical studies on North Korean children’s health, despite the
ample media reports of widespread malnutrition and infectious diseases. South Korea
and North Korea have been isolated from each other due to the politics of the Korean
War and the Cold War dynamics on the Korean Peninsula. Such separation from each
other while sharing the same ethnicity and early history provides a rich ground for
comparative research. However, there are few comparative studies on
children’s health in these two countries. There are two pertinent points of
comparison in this research. First is the impact of the “North Korean Famine
(1995–1998)” or “the Arduous March,” which has resulted
in children’s widespread malnutrition and stunting. South Korea did not
suffer from famine or malnutrition during the same period. A second point is the
remarkably different environmental circumstances due to the different pace and level
of economic development.
South Korea and North Korea have been divided since 1945 and their division has
solidified after the Korean War in 1950–1953 [15]. Over 7 decades, they have experienced different political regimes
and socio-economic development. We assume that the health status of children is
conspicuously different between South Korea and North Korea due to socioeconomic,
cultural, and environmental factors. Based on this assumption, we hypothesize that
harmful environmental circumstances exacerbate the gap in children’s health
in the two Koreas. Thus, this study aims to analyze the differences in
children’s health status and the correlation between the environment and
children’s health in South Korea and North Korea to answer three research
questions: (1) How different is the general status of children’s health
between South Korea and North Korea, and how has the gap changed over time? (2) What
are the disease patterns of children in the two Koreas? and (3) How much do the
environmental factors affect children’s health in South Korea and North
Korea? The comparative analysis will provide interesting findings since many
variables have been held constant due to the division. The comparative analysis will
help identify the patterns of, and gaps in, children’s health in South Korea
and North Korea from the perspective of environmental influences on disease patterns
across countries of varying levels of economic development.
A comparative study of children’s health in South Korea versus North Korea is
important for three reasons. First, it can provide a rich comparative analysis of
the effect of the environment on children’s health with many important health
factors held constant. Second, this study will help delineate how a developed, as
opposed to a developing, country’s environmental factors change as a result
of economic progress. Finally, it can contribute as a preparatory study to the
understanding of children’s health status of the two Koreas to prevent and
minimize social disturbances that can be caused by reunification.
Method
1. Data source
We used estimated data for North Korea since the country does not provide
official statistics on environmental and health measurements. We utilized data
provided by international organizations (for details of data source, see the
appendix [Table S1]). The collected (ecological) data are from 2000 to 2017 and
included two strands of indicators: (1) environmental indicators and (2)
children’s health status (mortality rate, prevalence). The collected data
were published by the World Bank and the World Health Organization (WHO) [16,17]. Environmental indicators include fine particulate matter
(PM2.5) exposure and air pollutant emissions, including gas
emissions and fossil fuels. In the supplementary material, we provide annual
population characteristics and medical and nutritional status collected from the
United Nations Children's Fund (UNICEF), Energy Information
Administration (EIA), World Bank, Organisation for Economic Co-operation and
Development (OECD), and Korea Statistical Information Service. We categorized
the indicators of children’s health status into four categories:
reproductive health, respiratory disease, chronic disease, and nutritional
disease.
2. Air pollution indicators
The annual mean PM2.5 concentration estimates were derived from the
Global Burden of Disease study [18–20]. These data are
estimates of the population-weighted average exposure and a general air quality
indication to inform cross-country comparisons of health risks. The population
estimation data are based on the Gridded Population of the World by NASA
Socioeconomic Data and Applications Center (version 4). The detailed description
of the exposure estimates is based on previous studies of global estimates of
air pollution and environmental risks [18–20]. The emission
data include carbon dioxide (CO2.5), nitrous oxide
(N2.5O), methane, and fossil fuel information.
3. Outcome indicators
Children’s health indicators consist of two types: (1) annual
children’s mortality rate (infant, stillbirth, neonatal, under-five,
ALRI), congenital anomalies, prematurity, birth asphyxia, diarrheal disease,
meningitis/encephalitis, sepsis and other infections) and (2) prevalence
(anemia, overweight, obesity, thinness). Infant mortality, stillbirth, and
neonatal mortality were calculated as deaths per 1,000 live births (0–4
years old). Mortality of under–five, ALRI, congenital anomalies,
prematurity, birth asphyxia, diarrheal disease, meningitis/encephalitis, sepsis
and other infections was calculated as deaths per 1,000 children (0–4
years old). We used data on the prevalence of anemia in children under 5 years
of age and that of overweight, obesity, and thinness in children 5–9
years of age. Here, overweight is defined as the Body Mass Index (BMI) exceeding
+1 SD above the median, obesity as the BMI exceeding +2 SD above the median, and
thinness means as a BMI is below median -2 SD.
4. Statistical analysis
We performed two analyses to examine how South Korea and North Korea are
differently situated after the “North Korean Famine” in terms of
air pollution and health status. First, we compared descriptive statistics for
South Korea and North Korea. Second, we performed trend analysis to observe how
children’s health status in South Korea and North Korea has changed over
time.
As the children’s health indicator data were estimated annually, we
focused on observing the changes per year. Overall, we considered three methods
for trend analysis of children’s health status: (1) Sen’s slope,
(2) Mann-Kendall trend test, and (3) linear regression. The first two methods
are used to analyze the trends for non-parametric data. If the beta coefficient
is greater than zero (β > 0), the data are considered to show a
positive trend. When there are many missing values, the Mann-Kendall trend test
can be used as a way to adjust missing data. This method validates significance
by using Kendall’s correlation coefficient.
We analyzed the correlation coefficient between environmental indicators and
children’s health status. Since our data spans from 2000 to 2017, the
number of pair samples for health status is 18. As the sample number is too
small to assume a specific distribution, we utilized Spearman’s
correlation based on the non-parametric method.
5. Sensitivity analysis
The sources of data in this study are international organizations. Since the data
we use are secondary, a direct comparison between the two Koreas is limited.
Thus, we cross-checked our results with the data reported by the OECD and the
South Korean government (Statistics Korea) for sensitivity analysis [21,22]. This study also extracted North Korean data from the South
Korean database (Statistics Korea).
Results
Over a total span of 18 years (2000–2017), we found a distinct gap between
South Korea and North Korea in two domains: (1) children’s health status
(mortality rate, prevalence) and (2) environmental indicators. Differences were
observed despite similar demographic trends from 2000 to 2018 – growing
population, increase in life expectancy, decrease in total fertility rate, and aging
(Table 1).
Table 1.
Demographic characteristics of South Korea and North Korea
*The slope coefficient for simple linear regression.
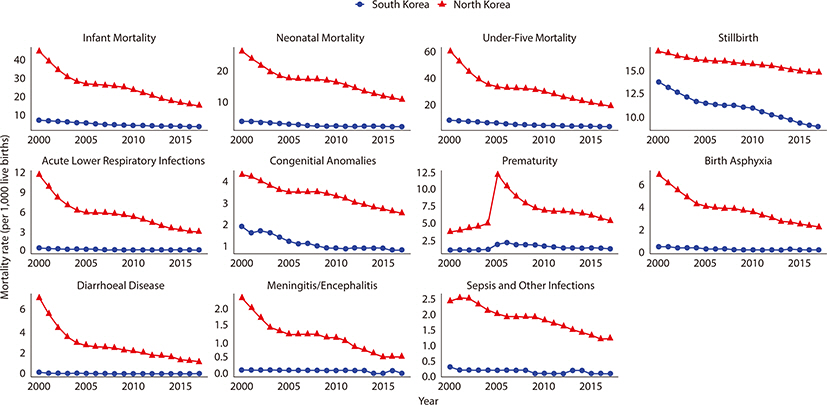
The time-plots show the trends in children’s annual mortality and prevalence
in South Korea and North Korea, respectively (Figs.
1, 2). The results of the trend
analysis are presented in the appendix (Table S2). Child mortality rates in South
Korea and North Korea are decreasing, except for prematurity. While North Korea
reported a higher death rate of children than South Korea, the gaps in
children’s mortality and their health status in both Koreas narrowed from
2000 to 2017 (Fig. 1). In particular, North
Korean children recorded a sharp decline in mortality rate indicators, especially
after 2005.
Fig. 1.
Trends in children’s health (mortality) in South Korea and North
Korea. The red line stands for children’s health status (mortality,
per 1,000 live births) in North Korea and the blue line for South
Korea.
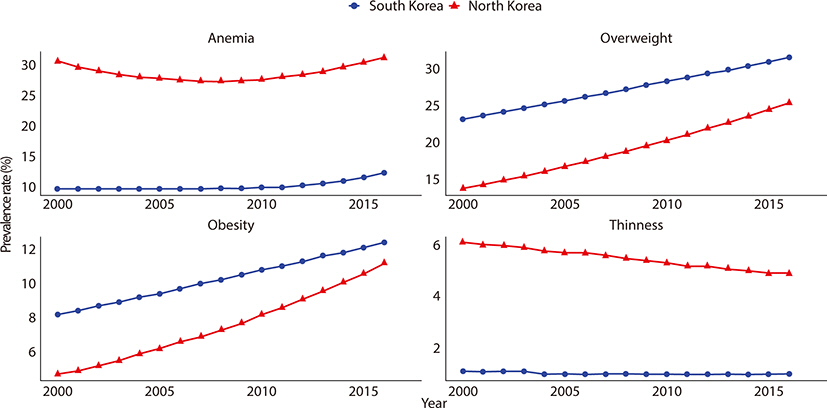
Fig. 2.
Trends in children’s health (prevalence) in South Korea and North
Korea. The red line stands for children’s health status (prevalence,
%) in North Korea and the blue line for South Korea.
The prevalence of overweight and obesity has increased and that of thinness decreased
in both Koreas (Fig. 2). While South Korean
children showed an increasing prevalence of anemia, North Korean children decreased
and then increased again in North Korean children after 2009. For North Korean
children under the age of 5 years who had anemia, a U–shaped pattern was
observed since it decreased in the early 2000s and then increased after 2008 (Fig. 2).
We discovered differences in environmental indicators between the two Koreas. Except
for PM2.5 exposure, South Korea recorded much higher figures than North
Korea in most indicators of air pollutant emissions such as CO2.5,
N2.5O, and methane emissions (Table
2 and Fig. S1). An interesting finding is that PM2.5
concentration estimates were higher in North Korea than in South Korea. North Korea
is faced with the danger of high PM2.5 concentration which is known to
increase the risk of children’s ALRI.
Table 2.
Comparison of environmental indicators in South Korea and North
Korea
South Korea
North Korea
P–value
n
Mean
SD
n
Mean
SD
Environmental indicator
PM2·5
(µg/m3)
10
28.3
2
10
36.5
2.8
0.002
CO2 emissions (metric tons per
capita)
17
10.6
1
17
2.3
0.9
<0.001
N2O emissions (thousand metric
tons of CO2 equivalent)
13
14,338.0
1,996.8
13
3,286.2
74.8
<0.001
Methane emissions (kt of CO2
equivalent)
13
31,680.5
703.4
13
18,390.4
671.1
<0.001
Fossil fuel (% of total)
16
82.4
1.2
15
79.5
13.1
0.421
P-value by Wilcoxon’s sign rank test.
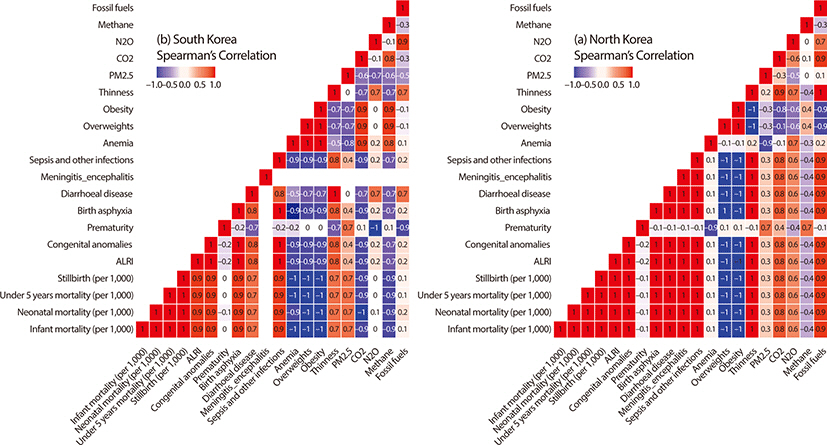
Given the differences in environmental indicators between South Korea and North
Korea, we examined the association between the environment and children’s
health. PM2.5 showed a positive relationship with infant and child
mortality indicators and a negative relationship with the prevalence of anemia,
overweight, and obesity in the two Koreas (Fig.
3). In the Poisson regression model, North Korea’s
PM2.5 exposure concentrations were related to infant mortality (%
increase: 9.07, 95% confidence interval [CI]: 3.06, 15.44), neonatal mortality (%
increase: 7.50, 95% CI: 0.52, 14.97), and under-five mortality (% increase: 8.67,
95% CI: 3.44, 14.17). Meanwhile, the correlation of CO2.5,
N2.5O, and fossil fuel emissions with health effects varied between
the two Koreas. It is positive in North Korea, while South Korea has a negative or
no correlation.
Fig. 3.
Correlation between air pollution exposure and children’s health
in South Korea and North Korea.
Discussion
There is a large gap in children’s health status between South Korea and North
Korea. Children living in North Korea experienced more severe health outcomes than
those in South Korea. The death rate of prematurity, congenital anomalies, and birth
asphyxia is higher in North Korea, which indicates that newborns in North Korea are
more susceptible to these diseases than their South Korean counterparts. This trend
has continued albeit with a decreasing rate over time. The time-plot of infant
mortality rate during the North Korean famine is provided in the supplementary
appendix (Figs. S2 and S3).
While South Korea recorded higher figures in air pollutant emissions such as
CO2.5, N2.5O, and methane than North Korea,
PM2.5 concentration estimates are higher in North Korea (Table 2). Although both Koreas are affected by
air pollution, including fine particulate matters and dust flying from China, North
Korea showed a higher rate of PM2.5 concentration estimates than South
Korea. We speculate that North Korea’s use of cooking and heating fuel with
low combustion rate and low thermal efficiency, as well as low-quality coal, has
resulted in a higher exposure to PM2.5 (Fig. S4). North Korea’s
use of ineffective domestic fuel is likely to release particulate matter and
increase the level of PM2.5 concentration over that in South Korea [23]. Fossil fuels, particularly coal and heavy
oil, in thermal power plants, industrial boilers, kilns, motor cars, and households
are the major pollutants in the largest city of North Korea (Pyongyang) and in
nearby industrial districts [24].
We also found a gap in prevalence indicators between the two Koreas. The prevalence
of anemia, overweight, obesity, and thinness is lagged for estimation, and North
Korean children are faced with a greater danger of anemia and thinness while those
in South Korea experience a higher prevalence of overweight and obesity. More
interestingly, the prevalence of overweight and obesity is increasing and that of
thinness is decreasing in both Koreas. This trend in prevalence indicators is
probably caused by nutritional factors rather than air pollution. The previous study
on North Korean refugee children residing in South Korea showed that the gap in
growth (height and weight) and obesity rates between South Korean and North Korean
children was narrowed after consuming sufficient food [25]. The nutritional status of South Korean and North Korean is
provided in the appendix (Table S3 and Fig. S5). It implies that poor nutritional
intake in North Korea has led to the children’s malnutrition causing anemia
and thinness, while the higher prevalence of overweight and obesity in South Korea
is most likely caused by a Westernized dietary pattern, which contains high amounts
of saturated fatty acids and energy-dense foods that are poor in micronutrients.
The differences in environmental indicators such as air pollutant emissions between
South Korea and North Korea created gaps in the children’s health status. The
higher emissions of environmental pollutants, including PM2.5, serve as a
trigger for increasing the incidence of respiratory diseases (ALRI, pneumonia, and
asthma) [4]. This relationship was supported
by another study showing that long-term exposure to ambient fine particulate matter
(PM2.5) is inversely associated with lung function in children,
adolescents, and young adults [26]. In
addition to air pollutants, lead is more noxious to children than adults [27]. In particular, anemia is observed in young
children who have lead poisoning [27]. Iron
deficiency anemia is a risk factor for lead toxicity, as it not only promotes pica
behavior but also increases the absorption of lead from the gastrointestinal tract
[28]. Lead exposure and nutritional
deficiencies, which are prevalent in North Korea, put children in danger of growth
retardation and behavioral challenges. For instance, the active use of inefficient
cooking and heating fuel such as a tire close to the furnace increases the level of
lead exposure among North Korean children. North Korean children have a higher risk
of respiratory infections caused by indoor air pollution from low-quality fuels.
Further, this study found an interesting pattern in diseases between South Korea and
North Korea. The two Koreas have been isolated from each other since 1945, sharing
the same ethnicity and similar genetic characteristics (Fig. S6). The different
environmental circumstances for over 7 decades since the division have led to very
different disease characteristics. North Korean children suffer from infectious
diseases such as parasite infection, tuberculosis, lower respiratory tract
infections, acute infectious diarrhea, malaria, meningitis, and sepsis. Infectious
diseases are prevalent in North Korea due to poor conditions – pollution of
drinking water (Figs. S7 and S8), weak management of vaccination, and unavailability
of antibiotics. In contrast, pediatric allergic, autoimmune, and metabolic diseases
are prevalent among South Korean children. The so-called “hygiene
hypothesis” explains this by assuming that microbes such as bacteria
stimulate the immune response and the too-clean environmental and hygienic
conditions decrease immunity so that people can be more susceptible to allergies and
autoimmune diseases [29,30]. As immune polarization caused by different environmental
stressors exists in South Korea and North Korea, the disease patterns are different
[14,31,32]. The disease pattern of
North Korean children is similar to that of developing countries, whereas the
disease pattern of South Korean children is similar to that of developed countries,
as illustrated in the appendix based on the mortality rate and prevalence of each
disease (Figs. S9–S12).
This study offers two key contributions. First, the study examines the gap in
children’s health between South Korea and North Korea, explores the
association between the environment and children’s health, and finds the
disease patterns of South Korea and North Korea to be similar to the differences
found between developed and developing countries. While there have been few studies
comparing the children’s health status between South Korea and North Korea,
this study empirically highlighted the differences and patterns of children’s
health, which helps to fill the lacunae in the children’s health studies.
Second, this study is meaningful in that it compared children’s health status
and environmental circumstances between South Korea and North Korea after the two
were forcibly divided in 1945 and further distanced by a war between the two in
1950¬–1953. The two countries in the Korean Peninsula provide an
interesting test-bed for a rich comparative analysis as a social experiment to
examine how South Korea and North Korea have evolved for over 7 decades since the
division in terms of the environment and children’s health.
Our findings should be interpreted, however, in light of data limitations. First,
official data on North Korean health, environment, or nutrition are not available.
Therefore, we used data collected from multiple international organizations
including the World Bank and WHO. Second, we cannot determine a direct relationship
between air pollution exposure and health effects in South Korea and North Korea due
to data constraints. To overcome this, we conducted comparative and trend analyses.
The differences in mortality and morbidity of children in the two Koreas might be
caused by socioeconomic and cultural factors, as well as environmental factors.
Thus, it would be necessary to secure national data for precise research to improve
North Korean children’s health. Therefore, more reliable data sources
representing a larger sample or that enable longitudinal studies such as cohort
studies are needed. Third, it is difficult to access prevalence indicators since
their availability is limited compared to mortality indicators. Lastly, the dataset
does not consider regional disparities within North Korea. It would be important to
identify regional differences to help reduce the health status gaps among different
regions.
Considering the patterns and gaps in children’s health between South Korea and
North Korea, more attention and resources need to be directed towards North Korea.
The current health status of North Korean children needs intensive international
development cooperation because the necessary commodities and services to improve
the health of children are lacking in North Korea (Fig. S13). Although the
governments of South Korea and North Korea have not had a Summit since 2018, there
is hope that future official summits between South Korea and North Korea, and with
other countries including the US could open doors for cooperation and unification.
Should North Korea become open to international development cooperation, South Korea
can play an important role in assisting North Korea although its assistance cannot
be counted toward foreign aid as the two do not recognize each other as separate
countries. Nevertheless, South Korea’s shared ethnicity, language, culture,
and geographical proximity would be very useful to assist the international efforts
for development cooperation in North Korea.
These findings imply that epigenetic modification resulting from environmental
stressors has had an impact on children’s health in South Korea and North
Korea despite sharing similar genetic backgrounds. After the division of the Korean
Peninsula, different environmental circumstances modified children’s health
in the two Koreas, with genetics held constant. Considering the effect of epigenetic
modification caused by environmental factors, it would be vital to develop a
strategy for improving public health, especially targeting North Korean children if
and when unification occurs. In particular, there is a danger that infectious
diseases can spread quickly in South Korea and North Korea since people across the
Korean Peninsula have not been exposed to each other for a long time. It is likely
that infectious diseases such as measles, tuberculosis, malaria, and parasite
infection, which are common in North Korea, can spread to South Korea, while other
infectious diseases and socially driven illnesses from South Korea can spread to
North Korea [33]. As South Korea established
a relatively stronger health infrastructure than North Korea (Table S4), advances in
the health care system can contribute to reducing the mortality rate. Thus, access
to optimal management and referral systems at the primary care level, stable supply
of nutrients, and removing economic barriers in North Korea would be crucial. Based
on the children’s disease patterns of South Korea and North Korea found in
this study, it is projected that infectious diseases will become more prevalent if
we do not have preventive measures. Given the significant differences in
children’s health between South Korea and North Korea which have persisted
for more than 7 decades, it is imperative to bridge this gap.
Acknowledgements
The research was funded by Ministry of Environment and Korea Environmental Industry
& Technology Institute (KEITI). Their support goes to Korean
Children’s Environmental health Study (Ko-CHENS) Project, which funded our
study. They had no input into the study design other than to support researchers. We
acknowledge all co-authors’ insight that enables interdisciplinary research
among various majors including international studies, North Korean studies,
women’s studies, sociology, public administration, medicine, nursing,
pediatrics, pharmaceutical sciences, obstetrics and gynecology, nutrition science
and food management, and system health science and engineering.
Conflict of Interest
No potential conflict of interest relevant to this article was reported.
Author Contribution
Conceptualization: Bang Y, Lee JH, Kang M
Formal Analysis: Ha H, Kim E, Kim YJ, Kim Y, Kang Y
Investigation: Kim M, Kim SH, Han JJ, Kim HS, Kwon O, Chung HW
Methodology: Kim HH, Oh J
Project Administration: Kim EM, Ha E
Writing – Original Draft: Bang Y, Oh J, Kim EM, Ha E
Writing – Review & Editing: Bang Y, Oh J, Kim EM, Lee JH, Kang M,
Kim M, Kim SH, Han JJ, Kim HS, Kwon O, Ha H, Kim HH, Chung HW, Kim E, Kim YJ,
Kim Y, Kang Y, Ha E
Ethics Approval and Consent to Participate
Not applicable.
Supplementary Materials
Supplementary materials are available from: https://doi.org/10.12771/emj.2022.e14.
Supplementary Table S1. Description of data characteristics
Supplementary Table S2. The analysis of children’s health indicators in
South Korea and North Korea from 2000 to 2017
Supplementary Table S3. The daily nutrition per person in South Korea and North
Korea from 1990 to 2017
Supplementary Table S4. The number of doctors in South Korea and North Korea
Supplementary Fig. S1. The average annual concentration of PM2.5 in
South Korea and North Korea from 2015 to 2019.
Supplementary Fig. S2. The estimation of birth losses and excess deaths during
the North Korean famine from 1994 to 2005.
Supplementary Fig. S3. The time–plot of annual infant mortality rates in
South Korea and North Korea from 1990 to 2019.
Supplementary Fig. S4. Coal consumption in South Korea and North Korea from 2000
to 2017.
Supplementary Fig. S5. The undernourished population of South Korea and North
Korea.
Supplementary Fig. S6. Major historical events in the Korean Peninsula from 1970
to 2020.
Supplementary Fig. S7. Quality of source drinking water in North Korea in
2017.
Supplementary Fig. S8. Quality of household drinking water in North Korea in
2017.
Supplementary Fig. S9. Disease pattern of North Korea with developing countries
(mortality rate per 1,000 live births).
Supplementary Fig. S10. Disease pattern of North Korea with developing countries
(prevalence (%)).
Supplementary Fig. S11. Disease pattern of South Korea with developed countries
(mortality rate per 1,000 live births).
Supplementary Fig. S12. Disease pattern of South Korea with developed countries
(prevalence (%)).
Supplementary Fig. S13. History of health and medical care policy in North Korea
from 1970 to 2020.
1. Sheffield PE, Landrigan PJ. Global climate change and children’s health: threats and
strategies for prevention. Environ Health Perspect 2011;119(3):291-298.
2. Suk WA, Ruchirawat KM, Balakrishnan K, Berger M, Carpenter D, Damstra T, et al. Environmental threats to children’s health in Southeast
Asia and the Western Pacific. Environ Health Perspect 2003;111(10):1340-1347.
3. Suk WA, Ahanchian H, Asante KA, Carpenter DO, Diaz-Barriga F, Ha EH, et al. Environmental pollution: an under-recognized threat to
children’s health, especially in low and middle-income
countries. Environ Health Perspect 2016;124(3):A41-A45.
4. Cordova JED, Aguirre VT, Apestegui VV, Ibarguen LO, Vu BN, Steenland K, et al. Association of PM2.5 concentration with health center outpatient
visits for respiratory diseases of children under 5 years old in Lima,
Peru. Environ Health 2020;19(1):7
6. Cohen AJ, Brauer M, Burnett R, Anderson HR, Frostad J, Estep K, et al. Estimates and 25-year trends of the global burden of disease
attributable to ambient air pollution: an analysis of data from the Global
Burden of Diseases Study 2015. Lancet 2017;389(10082):1907-1918.
7. Karimi B, Shokrinezhad B. Air pollution and mortality among infant and children under five
years: a systematic review and meta-analysis. Atmos Pollut Res 2020;11(6):61-70.
9. Smith KR, Samet JM, Romieu I, Bruce N. Indoor air pollution in developing countries and acute lower
respiratory infections in children. Thorax 2000;55(6):518-532.
10. Nwude EC, Ugwoke RO, Uruakpa PC, Ugwuegbe US, Nwonye NG. Official development assistance, income per capita and health
outcomes in developing countries: is Africa different? Cogent Econ Finance 2020;8(1):1774970
12. Breton CV, Landon R, Kahn LG, Enlow MB, Peterson AK, Bastain T, et al. Exploring the evidence for epigenetic regulation of environmental
influences on child health across generations. Commun Biol 2021;4(1):769
13. Toraño EG, García MG, Fernández-Morera JL, Niño-García P, Fernández AF. The impact of external factors on the epigenome: in utero and
over lifetime. BioMed Res Int 2016;2016:2568635
18. van Donkelaar A, Martin RV, Brauer M, Hsu NC, Kahn RA, Levy RC, et al. Global estimates of fine particulate matter using a combined
geophysical-statistical method with information from satellites, models, and
monitors. Environ Sci Technol 2016;50(7):3762-3772.
19. GBD 2017 Risk Factor Collaborators. Global, regional, and national comparative risk assessment of 84
behavioural, environmental and occupational, and metabolic risks or clusters
of risks for 195 countries and territories, 1990–2017: a systematic
analysis for the Global Burden of Disease Study 2017. Lancet 2018;392(10159):1923-1994.
20. Shaddick G, Thomas ML, Amini H, Broday D, Cohen A, Frostad J, et al. Data integration for the assessment of population exposure to
ambient air pollution for Global Burden of Disease
assessment. Environ Sci Technol 2018;52(16):9069-9078.
21. Organisation for Economic Co-operation and
Development. OECD Data - Korea [Internet] c2022;cited 2022 Aug 8. Available from https://data.oecd.org/korea.htm
22. Statistics Korea. North Korea Statistics Portal [Internet] c2022;cited 2022 Aug 2. Available from https://kosis.kr/bukhan/index.jsp
23. Kim JA, Kim SM, Lee JS, Oh HJ, Han JH, Song Y, et al. Dietary patterns and the metabolic syndrome in Korean
adolescents: 2001 Korean National Health and Nutrition
Survey. Diabetes Care 2007;30(7):1904-1905.
26. Guo C, Hoek G, Chang L, Bo Y, Lin C, Huang B, et al. Long-term exposure to ambient fine particulate matter
(PM2.5) and lung function in children, adolescents, and young
adults: a longitudinal cohort study. Environ Health Perspect 2019;127(12):127008
32. Bloomfield SF, Stanwell-Smith R, Crevel RWR, Pickup J. Too clean, or not too clean: the hygiene hypothesis and home
hygiene. Clin Exp Allergy 2006;36(4):402-425.
33. Kim JS. Children of peace. Seoul: Bookludens; 2018.
Figure & Data
References
Citations
Citations to this article as recorded by
Deep learning-based forecasting of daily maximum ozone levels and assessment of socioeconomic and health impacts in South Korea Seyedeh Reyhaneh Shams, Yunsoo Choi, Deveshwar Singh, Sagun Kayastha, Jincheol Park Science of The Total Environment.2025; 983: 179684. CrossRef
Comparative Analysis of Health Patterns and Gaps due to Environmental
Influences in South Korea and North Korea, 2000–2017
Fig. 1.
Trends in children’s health (mortality) in South Korea and North
Korea. The red line stands for children’s health status (mortality,
per 1,000 live births) in North Korea and the blue line for South
Korea.
Fig. 2.
Trends in children’s health (prevalence) in South Korea and North
Korea. The red line stands for children’s health status (prevalence,
%) in North Korea and the blue line for South Korea.
Fig. 3.
Correlation between air pollution exposure and children’s health
in South Korea and North Korea.
Fig. 1.
Fig. 2.
Fig. 3.
Comparative Analysis of Health Patterns and Gaps due to Environmental
Influences in South Korea and North Korea, 2000–2017
Demographic characteristics of South Korea and North Korea
Year
Population (1,000
people)
Life expectancy (yr)
Total fertility rate (births
per 1,000 women)
South Korea
North Korea
South Korea
North Korea
South Korea
North Korea
Total
Male
Female
Total
Male
Female
2000
47,008
22,702
76.0
72.3
79.7
65.3
61.2
69.0
1.48
1.99
2001
47,370
22,902
76.5
72.9
80.1
66.1
62.1
69.7
1.31
1.99
2002
47,645
23,088
76.8
73.4
80.3
66.9
63.0
70.4
1.18
1.99
2003
47,892
23,254
77.3
73.8
80.8
67.6
63.8
71.0
1.19
1.99
2004
48,083
23,411
77.8
74.3
81.2
68.1
64.3
71.5
1.16
1.98
2005
48,185
23,561
78.2
74.9
81.6
68.4
64.7
71.7
1.09
1.98
2006
48,438
23,707
78.8
75.4
82.1
68.5
64.8
71.8
1.13
1.97
2007
48,684
23,849
79.2
75.9
82.5
68.7
65.0
72.0
1.26
1.96
2008
49,055
23,934
79.6
76.2
83.0
68.9
65.3
72.2
1.19
1.95
2009
49,308
24,062
80.0
76.7
83.4
69.2
65.6
72.5
1.15
1.94
2010
49,554
24,187
80.2
76.8
83.6
69.6
66.0
72.9
1.23
1.94
2011
49,937
24,308
80.6
77.3
84.0
70.0
66.4
73.3
1.24
1.93
2012
50,200
24,427
80.9
77.6
84.2
70.5
66.8
73.8
1.30
1.93
2013
50,429
24,545
81.4
78.1
84.6
70.9
67.2
74.2
1.18
1.93
2014
50,747
24,662
81.8
78.6
85.0
71.2
67.6
74.5
1.21
1.93
2015
51,015
24,779
82.1
79.0
85.2
71.5
67.8
74.9
1.24
1.92
2016
51,218
24,897
82.4
79.3
85.4
71.7
68.1
75.1
1.17
1.92
2017
51,362
25,014
82.7
79.7
85.7
71.9
68.3
75.3
1.05
1.91
Average (SD)
49,229.4 (1,394.1)
23,960.5 (702.7)
79.6 (2.1)
76.2 (2.3)
82.9 (2.0)
69.2 (1.9)
65.4 (2.1)
72.5 (1.9)
1.2 (0.1)
2.0 (0.0)
Sen’s slope (95% CI)
260.3 (253, 272.9)
125.3 (120.0, 134.7)
0.4 (0.4, 0.4)
0.4 (0.4, 0.4)
0.4 (0.3, 0.4)
0.3 (0.3, 0.4)
0.4 (0.3, 0.4)
0.3 (0.3, 0.4)
0.00 (–0.02, 0.01)
0.00 (–0.01, –0.00)
Mann-Kendall statistics
5.8 (P–value <0.001)
5.8 (P–value <0.001)
5.8 (P–value <0.001)
5.8 (P–value <0.001)
5.8 (P–value <0.001)
5.8 (P–value <0.001)
5.8 (P–value <0.001)
5.8 (P–value <0.001)
–0.8 (P–value: 0.425)
–5.3 (P–value:
<0.001)
β (Slope) (95% CI)*
260.6 (252.5, 268.7)
131.2 (125.9, 136.5)
0.4 (0.4, 0.4)
0.4 (0.4, 0.4)
0.4 (0.3, 0.4)
0.4 (0.3, 0.4)
0.4 (0.3, 0.4)
0.3 (0.3, 0.4)
0.01 (–0.02, 0.00)
0.00 (–0.01, 0.00)
*The slope coefficient for simple linear regression.
Comparison of environmental indicators in South Korea and North
Korea
South Korea
North Korea
P–value
n
Mean
SD
n
Mean
SD
Environmental indicator
PM2·5
(µg/m3)
10
28.3
2
10
36.5
2.8
0.002
CO2 emissions (metric tons per
capita)
17
10.6
1
17
2.3
0.9
<0.001
N2O emissions (thousand metric
tons of CO2 equivalent)
13
14,338.0
1,996.8
13
3,286.2
74.8
<0.001
Methane emissions (kt of CO2
equivalent)
13
31,680.5
703.4
13
18,390.4
671.1
<0.001
Fossil fuel (% of total)
16
82.4
1.2
15
79.5
13.1
0.421
P-value by Wilcoxon’s sign rank test.
Table 1.
Demographic characteristics of South Korea and North Korea
The slope coefficient for simple linear regression.
Table 2.
Comparison of environmental indicators in South Korea and North
Korea

 , Jongmin Oh2