This is an Open-Access article distributed under the terms of the Creative Commons Attribution Non-Commercial License (http://creativecommons.org/licenses/by-nc/4.0) which permits unrestricted non-commercial use, distribution, and reproduction in any medium, provided the original work is properly cited.
Blood and urine are commonly used specimens for clinical testing, and their contents, particularly exosomal microRNA (miRNA), are diverse, reflecting the metabolic activities of tissues and organs in the body.
Methods:
Blood and urine samples were collected from six healthy adults. Exosomes were then enriched from these samples, followed by sequencing and bioinformatic analysis of exosomal miRNA.
Results:
The comparative analysis of miRNAs in blood and urine revealed that 41 miRNAs were more abundant in blood, while 61 were found at lower levels. Notably, hsa-miR-934 was among those with higher expression in blood, whereas hsa-miR-425-5p was one of the miRNAs with lower expression. Kyoto Encyclopedia of Genes and Genomes pathway analysis indicated that the target mRNAs of differentially expressed exosomal miRNAs (DEexo-miRNAs) in both blood and urine are implicated in various signaling pathways, including proteoglycans in cancer, axonal guidance, and the regulation of the actin cytoskeleton. Additionally, the target mRNAs associated with DEexo-miRNAs in urine were also linked to processes such as ubiquitin-mediated proteolysis and the phosphatidylinositol signaling system. In contrast, the target mRNAs corresponding to DEexo-miRNAs in blood were involved in the FoxO signaling pathway and chronic myeloid leukemia, among others.
Conclusion:
This study observed differential expression of exosomal miRNAs in blood and urine, thereby enriching the available library of exosomal miRNA for these two sample types. It also lays the groundwork for the detection of exosomal biomarkers from blood and urine.
MicroRNA (miRNA) is a type of endogenous non-coding RNA (ncRNA) with a regulatory function found in eukaryotes, typically ranging from 18 to 25 nucleotides in length. Mature miRNA is generated through a series of nuclease cleavages and processing of longer precursor transcripts. It is then incorporated into RNA-induced silencing complexes. These complexes recognize target mRNA through base-pair complementarity, guiding the RNA-induced silencing complexes to either degrade the target mRNA or inhibit its translation, depending on the degree of complementarity [1,2]. Recent studies have shown that miRNAs play roles in a variety of regulatory pathways. These include development, viral defense, hematopoiesis, organogenesis, cell proliferation and apoptosis, as well as lipid metabolism [2-5].
Exosomes have recently become a prominent topic, and the analysis of their cargo has garnered significant attention [6-9]. The double-layered lipid membrane of exosomes ensures the stability of their internal contents, providing a more accurate reflection of the physiological and pathological states of their cells of origin. Consequently, exosome research has been incorporated into the realm of liquid biopsy, complementing studies on circulating tumor cells and cell-free nucleic acids [10]. Our previous research indicated that the detection of exosome-derived miRNAs is more consistent than that of mRNAs [11]. However, several questions remain unanswered: Are exosomal miRNAs uniformly expressed in different bodily fluids, such as blood and urine, within the same human body? Which exosomal miRNA is present across various bodily fluids under normal physiological conditions? Which body fluid is more suitable for the detection of extracellular vesicles in future studies? Currently, these issues remain unresolved. This study presents a comparative analysis of exosomal miRNAs in urine and blood under physiological conditions.
Methods
Ethics statement
This study was approved by the Ethics Committee of Chengdu University (no. 2081920062). All participants understood the purpose and content of the study and signed informed consent.
Specimen source and pre-treatment
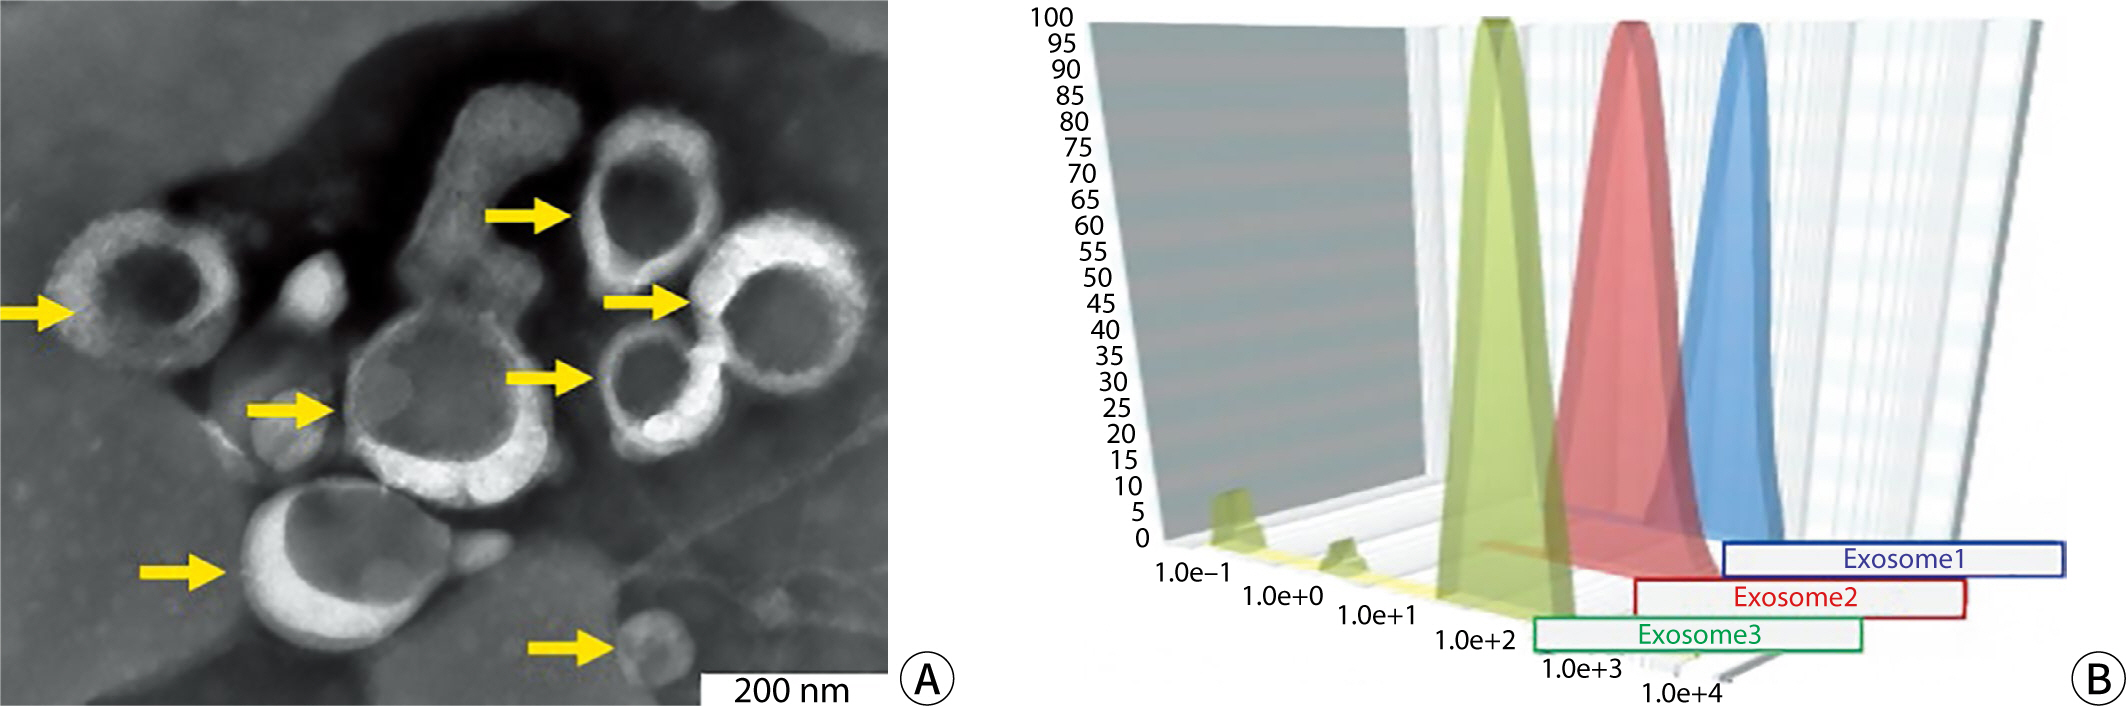
Urine samples were obtained from morning midstream collections, and blood samples were drawn from fasting individuals who had not eaten for more than 10 hours—specifically, 10 mL of peripheral venous blood and 100 mL of urine were collected from six healthy adults. These volunteers had not taken any medications for at least seven days prior to sample collection. The basic information for the six individuals is presented in Table 1. Blood samples, treated with EDTA as an anticoagulant, were centrifuged at 1,000×g for 15 minutes, and the resulting supernatant was retained. After further centrifugation at 10,000×g for 10 minutes at 4℃, ammonium sulfate powder was added to achieve a final concentration of 1.06%. The mixture was then centrifuged again at 10,000×g for 15 minutes at 4℃, and the supernatant was aspirated. An equal volume of 16% polyethylene glycol solution was added to the remaining solution and left to stand overnight at 4℃. Following centrifugation at 4,000×g for 1 hour, the supernatant was carefully removed, and the pellet, containing the exosomes, was collected. The enrichment and identification of urinary exosomes were carried out in accordance with established protocols [12,13]. The results of the electron microscopy examination of the exosomes and the particle size analysis are depicted in Fig. 1.
Table 1.
The basic information of six healthy individuals
Age
Sex
BMI (kg/m2)
FBG (mmol/L)
hs-CRP (mg/L)
Urinary pH value
Urine specific gravity
36
Male
22
4.95
9.45
6.5
1.010
27
Female
20
4.80
2.33
6.0
1.015
42
Male
23
6.00
8.55
7.0
1.012
35
Female
23
5.33
3.44
7.5
1.020
23
Male
20
3.98
1.67
5.3
1.024
58
Female
27
6.00
9.88
4.8
1.023
BMI, body mass index; FBG, fasting blood glucose; hsCRP, high-sensitivity C-reactive protein.
Fig. 1.
Identification of exosomes. (A) Electron microscopy of exosomes: the typical single concave tea tray-shaped structure of exosomes (bar=200 nm). (B) Detection of exosomes using a nanoparticle size analyzer: particle aggregation peak with a diameter of approximately 110 nm.
Exosomal microRNA sequencing
The sequencing was conducted in accordance with the manual provided by Illumina, which included steps for library preparation and sequencing experiments. The small RNA sequencing library was prepared using TruSeq Small RNA Sample Prep Kits (Illumina, San Diego, CA, USA). Once the library preparation was complete, the constructed library was sequenced on an Illumina HiSeq 2000/2500 platform, utilizing a single-end read length of 50 bp.
Exosome microRNA analysis
FastQC version 0.10.1 was utilized for data quality control, ACGT101-miR version 4.2 for basic miRNA analysis, ACGTUNAfold version 3.7 for advanced miRNA analysis, TargetScan version 5.0 and Miranda version 3.3a for miRNA target gene prediction, Pathway Network version 1.6 for target gene function analysis, and R software version 3.0.1 for mapping of result files. The databases used in the study are listed in Table 2.
miRNA, microRNA; KEGG, Kyoto Encyclopedia of Genes and Genomes.
Statistical analysis
The experimental data are expressed as the mean±SE. The input data for miRNA differential expression analysis consisted of normalized values. The P-value was calculated using a model based on the normal distribution. When biological replicates were present, the t-test was used to analyze differences between two groups of samples, and analysis of variance was employed for analyzing differences among multiple groups.
Results
Data quality control results
The total number of reads for urinary exosomes ranged from 23,699,840 to 34,395,054, and the total number of bases ranged from 1,208,691,840 to 1,754,147,754, with averages of 27,871,527.67±5,722,347.37 and 1,421,447,911±291,839,716, respectively. The base composition ratios of adenine (A), thymine (T), cytosine (C), and guanine (G) varied from 21.94% to 31.81%. The Q20 and Q30 quality scores of the reads were between 96.14% and 99.29%, and the overall GC content of the reads ranged from 49.55% to 53.97%. For blood exosomes, the total number of reads and total bases were 17,002,521 to 38,704,493 and 867,128,571 to 1,973,929,143, respectively. The averages were 2,588,481.33±11,374,109.12 for reads and 1,320,128,948±580,079,565 for bases. The base composition ratios of A, T, C, and G were between 22.69% and 30.08%. The Q20 and Q30 quality scores of the total reads ranged from 91.61% to 99.40%, with the overall GC content of the reads between 52.55% and 52.91%. As indicated in Table 3, there was no significant difference between the groups (P>0.05).
Table 3.
Quality control results of miRNA sequencing data from blood and urine exosome
Sample_ID
Total_Reads
Total_Bases
A%
T%
C%
G%
Q20%
Q30%
GC%
Urine exosomes
27,871,527.67±5,722,347.37
1,421,447,911±291,839,716
23.87±1.80
23.98±1.03
22.49±0.63
29.67±2.18
99.05±0.34
96.98±0.75
52.15±2.31
Blood exosomes
25,884,881.33±11,374,109.12
1,320,128,948±580,079,565
23.24±0.75
24.01±0.91
23.56±0.86
29.18±0.81
97.87±2.63
95.77±3.60
52.74±0.18
P-value
0.8003
0.8003
0.6056
0.9717
0.1571
0.7336
0.4839
0.5992
0.6820
Q20% reflects the quality of the data, indicating that in the sequencing results, the probability of a base error at a certain position caused by the sequencing instrument is less than 1%; Q30% indicates that in the sequencing results, the probability of a base error at a certain position caused by the sequencing instrument is less than 0.1%.
miRNA, microRNA.
Comparative analysis of the Rfam database
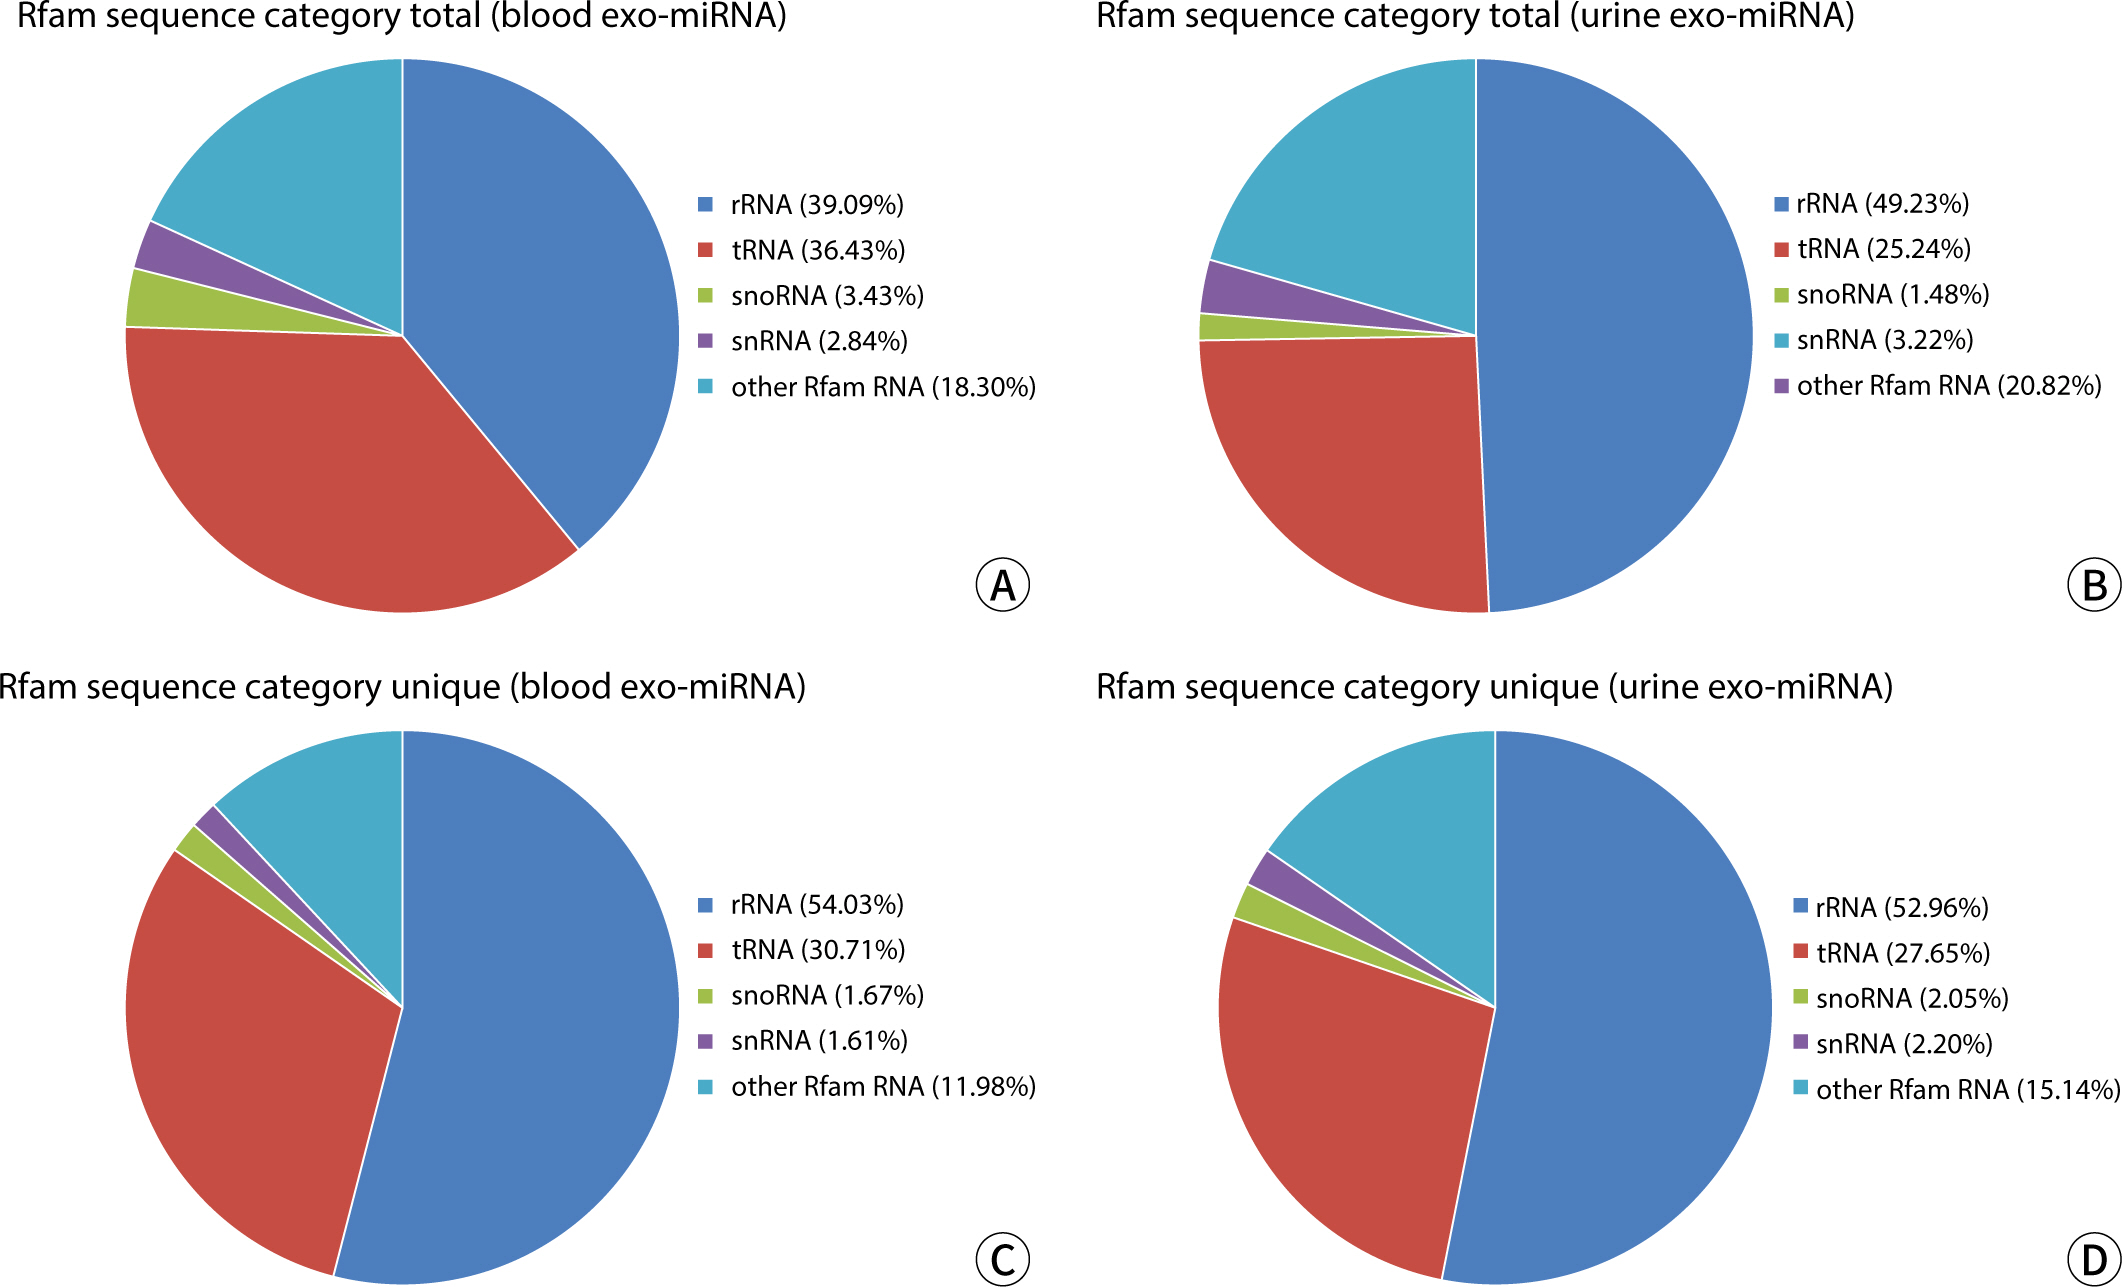
Rfam is a database of ncRNA families, which includes ribosomal RNA (rRNA), transfer RNA (tRNA), small nucleolar RNA (snoRNA), small nuclear RNA (snRNA), miRNA, and other ncRNAs. The annotated sequences of rRNA, snoRNA, snRNA, tRNA, and other RNAs were extracted from the clean data produced by the sequencing machine, using the Rfam database as a reference. The results are presented in Table 4 and have been statistically analyzed and visualized, showing the mean of total reads and unique reads in Fig. 2. There were no significant differences observed between the groups (P>0.05).
Table 4.
Rfam category statistics of blood and urine exosomes
Library
Total reads
Unique reads
Blood
Urine
P-value
Blood
Urine
P-value
rRNA
664,436.33±89,892.42
716,135.67±420,629.50
0.8453
16,146.67±4,995.21
11,825.67±1,730.40
0.2298
tRNA
619,247.33±409,943.55
367,148.33±284,480.43
0.4309
9,178.00±5,089.72
6,175.00±3,168.85
0.4346
snoRNA
56,828.33±75,016.46
21,599±12,498.19
0.4673
500.00±357.22
457.33±238.68
0.8718
snRNA
48,305.67±49,710.85
46,866±24,310.35
0.9662
479.67±267.73
491.00±226.30
0.9580
Other Rfam RNA
311,030.67±229,410.06
302,926±103,992.12
0.9582
3,579.33±1,690.04
3,382.00±1,622.64
0.8911
rRNA, ribosomal RNA; tRNA, transfer RNA; snoRNA, small nucleolar RNA; snRNA, small nuclear RNA.
Fig. 2.
Pie charts displaying the proportions of rRNA, snoRNA, snRNA, tRNA and some other non-miRNA sequences, referring to the Rfam database. (A,B) Statistics and visualization in total read; (A) blood, (B) urine. (C,D) Statistics and visualization for unique read; (C) blood, (D) urine. miRNA, microRNA; rRNA, ribosomal RNA; tRNA, transfer RNA; snoRNA, small nucleolar RNA; snRNA, small nuclear RNA.
Comparative analysis of Repbase database
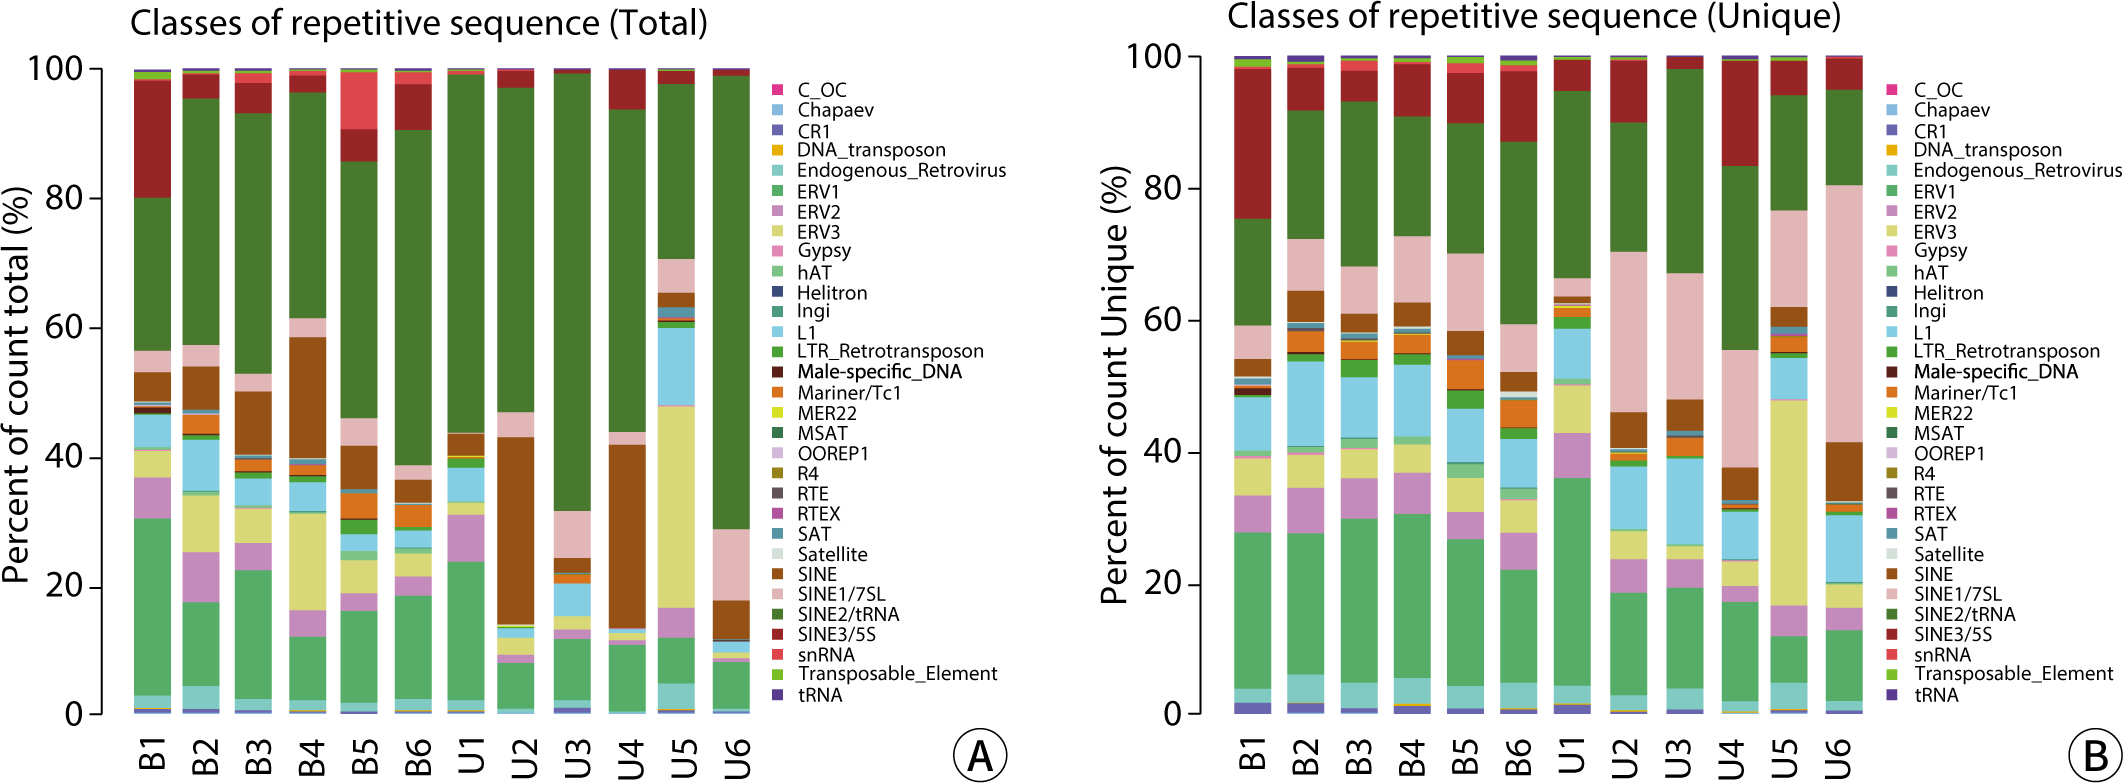
The Repbase database is a comprehensive collection of repeat sequences in eukaryotic DNA, encompassing transposable elements, tandem repeat sequences (such as satellite sequences or microsatellites), scattered genomic repeat sequences, and certain multicopy host genes (including rRNA, tRNA, and histone genes). Annotated repeat-associated sRNA sequences were extracted from the clean data produced by the sequencing machine, using the Repbase database as a reference. The data for total reads and unique reads were analyzed both statistically and visually (Fig. 3). The categorized data from the Repbase database are presented in Table 5. There was no significant difference between the blood and urine groups, with the exception of the total L1 sequence (P<0.05).
Fig. 3.
Stacked graphs presenting a comparison of the two types of data based on the Repbase database. (A) Total reads (%), (B) unique reads (%).
Table 5.
Repbase database category data of blood and urine exosomes
Type
Total reads
Unique reads
Blood
Urine
P-value
Blood
Urine
P-value
CR1
158.33±105.29
460.67±391.79
0.2663
7.00±2.65
11.33±3.21
0.1458
DNA_transposon
5.33±5.51
23.67±40.99
0.4854
0.67±0.58
0.67±1.15
1.0000
Endogenous_Retrovirus
631.67±203.29
1,172.67±617.80
0.2230
22.00±12.53
35.00±14.80
0.3101
ERV1
7,303.00±3,428.55
12,029.67±9,812.39
0.4749
147.00±75.43
233.67±69.74
0.2178
ERV2
1,541.33±861.59
2,453.67±819.99
0.2547
34.67±10.60
63.67±24.95
0.1375
ERV3
1,729.67±1,011.16
6,242.33±7,672.87
0.3697
35.67±15.14
59.67±39.55
0.3819
Gypsy
20.33±28.57
2.00±3.46
0.3318
1.00±1.00
0.33±0.58
0.3739
hAT
375.67±385.70
70.00±19.47
0.2423
12.00±9.85
5.67±0.58
0.3285
Ingi
16.33±18.23
0
0.1956
1.00±1.00
0
0.1583
L1
1,314.67±642.18
4,333.33±1,739.74
0.0479
55.00±27.07
160.00±123.48
0.2236
LTR_Retrotransposon
498.33±695.27
582.33±121.84
0.8468
13.67±13.87
11.33±4.04
0.7935
Male-specific_DNA
127.33±200.12
2.00±3.46
0.3391
1.67±2.08
0.33±0.58
0.3453
Mariner/Tc1
1,027.00±1,099.83
197.33±118.89
0.2638
24.67±23.01
19.67±10.07
0.7476
OOREP1
12.33±21.36
0
0.3739
0.33±0.58
0
0.3739
MER22
0
126.00±124.53
0.1546
0
2.00±1.73
0.1161
MSAT
0
4.00±6.93
0.3739
0
0.67±1.15
0.3739
RTE
0
2.67±4.62
0.3739
0
0.33±0.58
0.3739
RTEX
0
7.33±12.70
0.3739
0
0.67±1.15
0.3739
R4
5.67±9.81
4.33±7.51
0.8608
0.33±0.58
0.33±0.58
1.0000
SAT
190.33±153.05
291.33±438.60
0.7256
4.33±2.52
5.00±4.58
0.8360
Satellite
21.67±21.03
17.67±26.39
0.8474
2.00±2.65
2.00±2.65
1.0000
SINE
2,050.33±1,447.02
7,130.00±10,174.03
0.4402
22.33±13.80
95.67±138.26
0.4124
SINE1/7SL
1,392.33±946.64
12,243.67±18,914.70
0.3772
63.33±54.24
419.67±605.41
0.3673
SINE2/tRNA
14,275.67±6,922.48
85,443.00±114,958.14
0.3448
147.33±68.85
252.67±147.75
0.3257
SINE3/5S
3,721.33±2,783.05
1,386.33±1,270.52
0.2567
82.33±20.50
71.33±57.36
0.7701
snRNA
1,824.67±2,724.41
0
0.3106
7.00±7.21
0
0.1680
Transposable_Element
223.33±220.37
71.33±14.57
0.2991
6.00±2.65
3.67±0.58
0.2099
tRNA
60.67±60.35
19.00±28.69
0.3409
2.33±1.53
0.67±0.58
0.1518
Candidate RNA length distribution
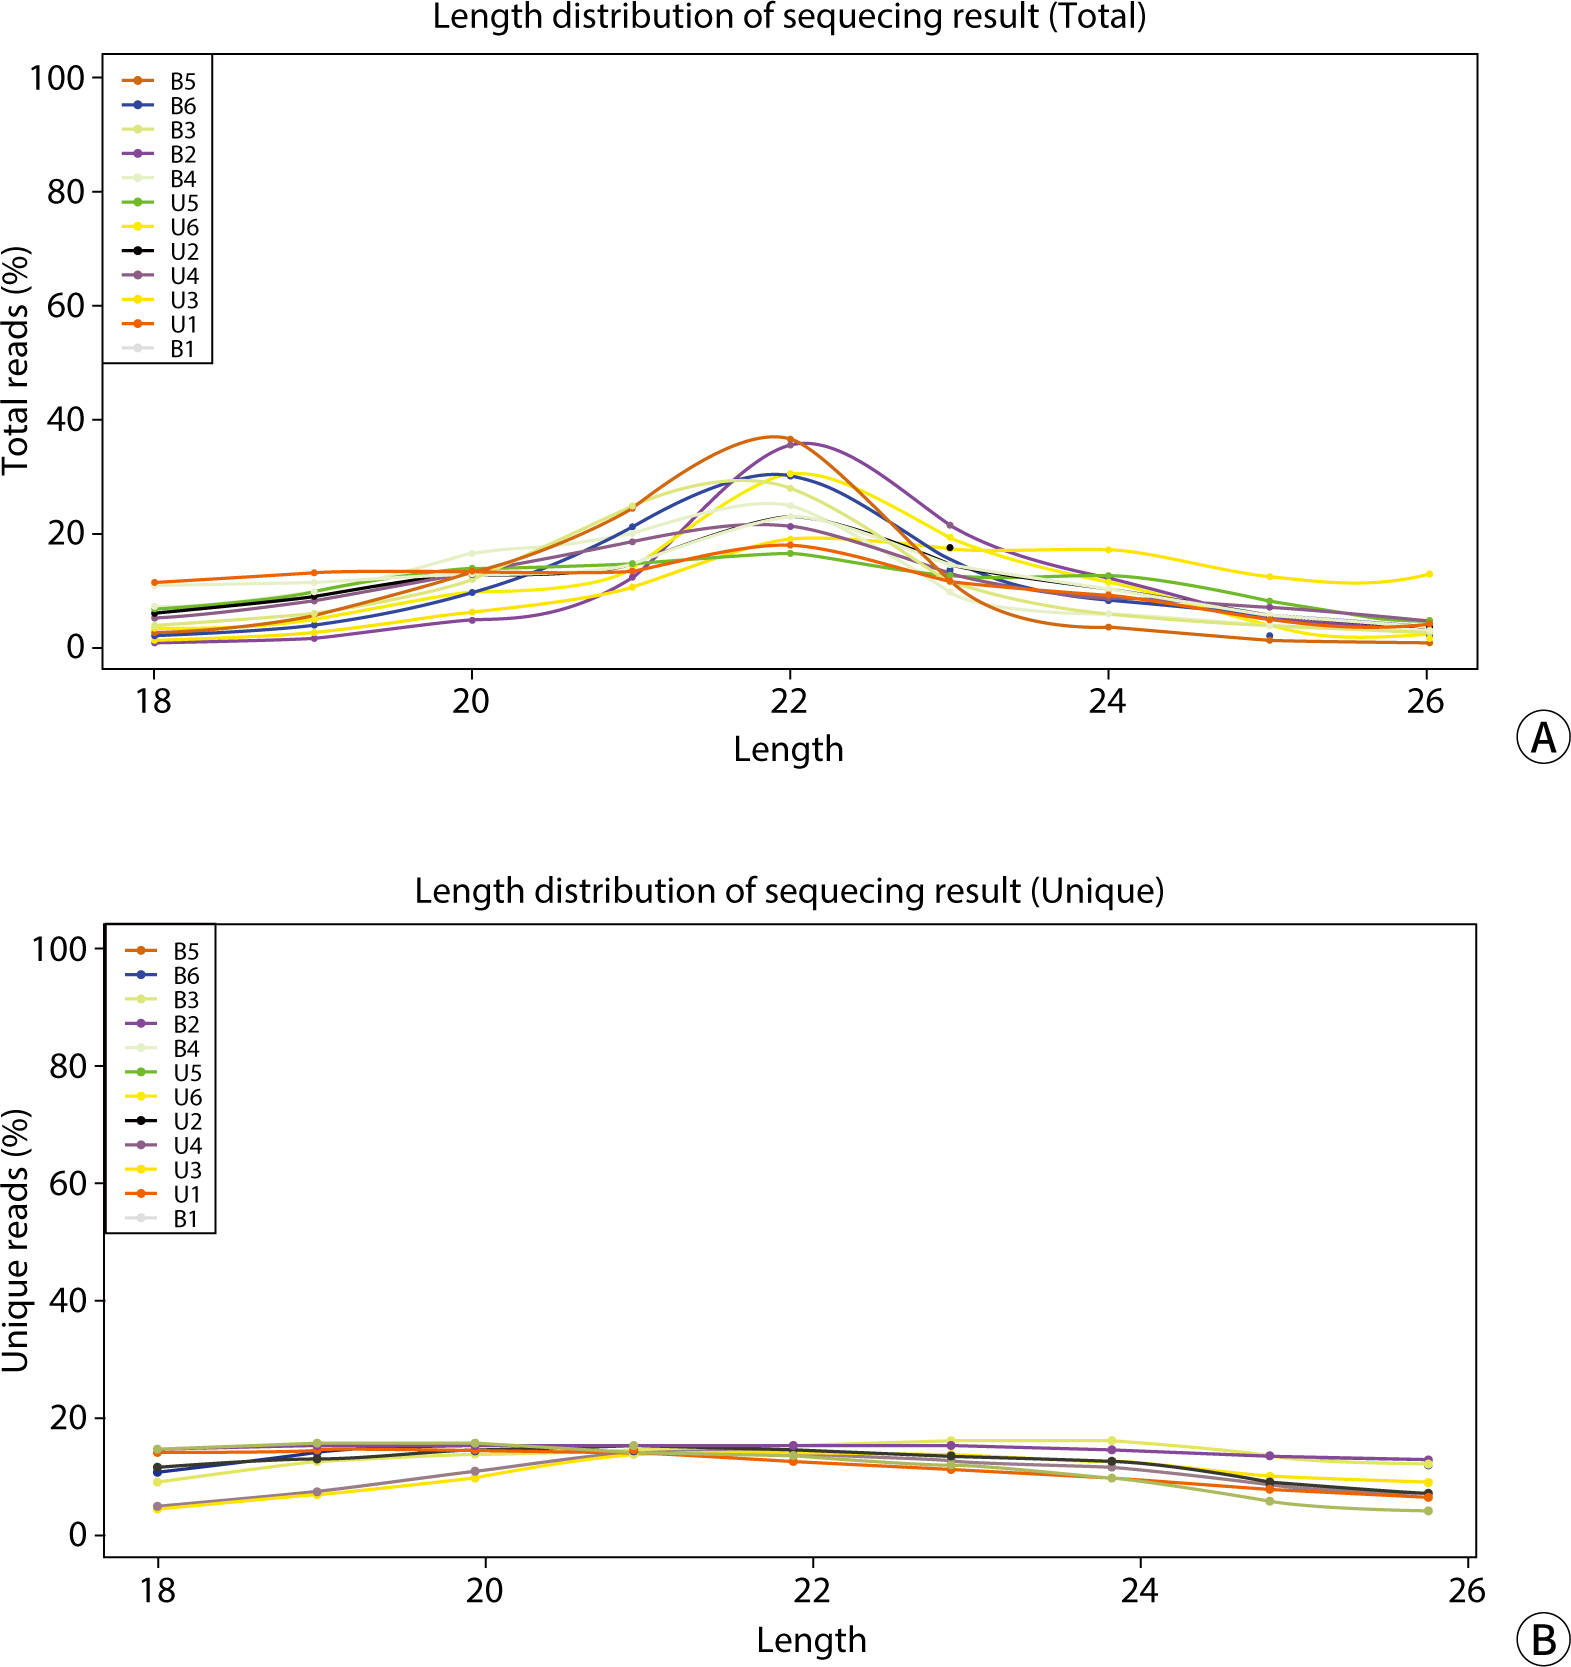
Based on the analysis and statistics of the original sequencing data, we carried out an assessment of the length distribution for both the total and unique numbers of the filtered valid data. As depicted in Fig. 4, the total reads were primarily concentrated in the 22-nucleotide length region. The unique reads were predominantly found within the 19–21 nucleotide range, with a slightly lower distribution at lengths 18 and 22–24, and minimal presence at length 26. When comparing the results from blood and urinary exosomes (Table 6), significant differences were observed between the groups in the 20–23 and 25–26 nucleotide lengths, as well as in the valid reads (P<0.05) for unique reads. However, no significant differences were found between blood and urine in total reads and other unique read lengths.
Fig. 4.
Length distribution of the sequencing results. (A) Total reads (%), (B) unique reads (%).
Table 6.
Length distribution of the sequencing results of blood and urine exosomes
Length
Total reads
Unique reads
Blood
Urine
P-value
Blood
Urine
P-value
18
436,361.00±143,478.88
993,080.67±471,516.15
0.1220
50,807.33±28,024.14
109,079.33±36,787.36
0.0945
19
663,565.67±221,921.31
1,328,995.33±611,193.97
0.1509
55,624.00±32,124.51
136,549.00±40,863.32
0.0543
20
1,352,551.67±801,446.33
1,802,782.33±729,445.32
0.5116
57,068.00±31,853.45
154,423.67±51,343.34
0.0493
21
2,530,332.00±1,624,499.74
2,050,522.67±649,025.54
0.6595
57,933.00±30,115.17
161,037.00±55,019.65
0.0465
22
3,577,806.00±2,569,496.50
3,027,407.00±996,219.06
0.7468
53,488.00±27,137.48
149,230.67±48,943.87
0.0414
23
1,448,801.67±815,249.61
2,050,510.33±642,210.98
0.3721
46,007.00±21,993.58
131,136.33±48,280.39
0.0499
24
673,059.33±364,409.83
1,636,292.33±663,391.86
0.0922
39,495.67±16,834.52
118,143.67±48,698.24
0.0574
25
428,329.00±284,580.69
877,942.00±586,115.02
0.2980
25,034.33±7,529.50
90,539.00±31,209.68
0.0241
26
267,313.67±139,584.21
563,885.33±246,623.50
0.1441
18,557.33±3,910.05
69,582.33±16,221.38
0.0061
Valid reads
11,378,120.00±5,998,577.15
14,331,418.00±3,925,298.36
0.5149
404,014.67±193,601.66
1,119,721.00±350,791.92
0.0364
MicroRNA identification and predictive analysis
The accuracy of miRNA identification is highly correlated with the accuracy of miRBase, the genome of the species in question, and the completeness of the database. Clean data, which are essential for analysis, were utilized to identify small RNAs. The miRNA expression levels in each sample were determined using ACGT101 miR software. These expression levels were then used to evaluate the correlation of gene expression characteristics both within and between groups, as well as to evaluate the differential expression of miRNAs. When measuring expression levels, the normalized value (standardized based on the original miRNA read counts) was employed as the metric for miRNA expression, enabling the comparison of miRNA expression across different samples.
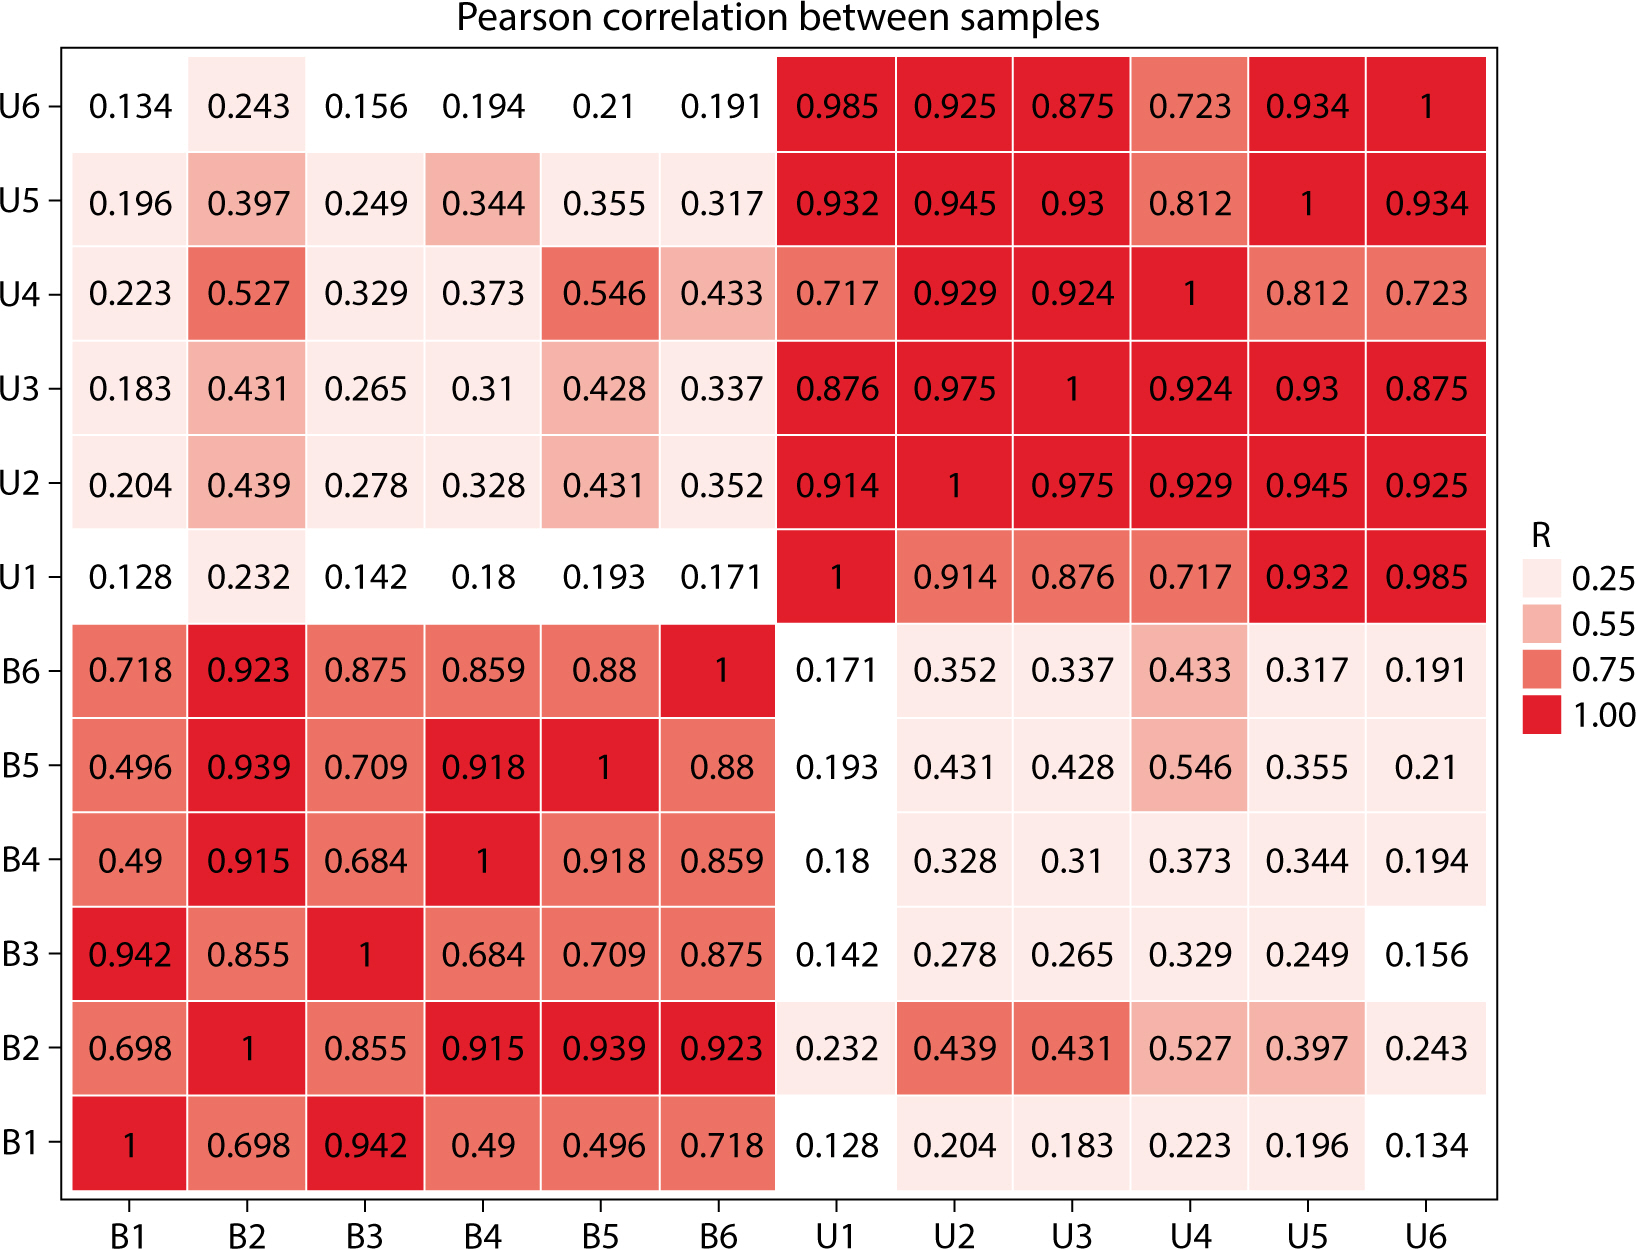
Sample correlation analysis
Correlation analysis, utilizing gene expression data from samples, can more accurately determine the clustering relationship among samples. A higher correlation coefficient indicates better clustering of the samples. By employing the Pearson correlation coefficient, we can assess the repeatability among samples and identify potential outliers. As shown in Fig. 4, the correlation coefficients between the six blood and urine samples ranged from 0.49 to 1. Specifically, blood samples had correlation coefficients ranging from 0.49 to 1, while urine samples had coefficients between 0.717 and 1. Notably, the correlation coefficients for the fourth urine sample and the first blood sample were relatively low when compared to the other samples (Fig. 5).
Fig. 5.
Correlation analysis of gene expression between three blood samples and three urine samples.
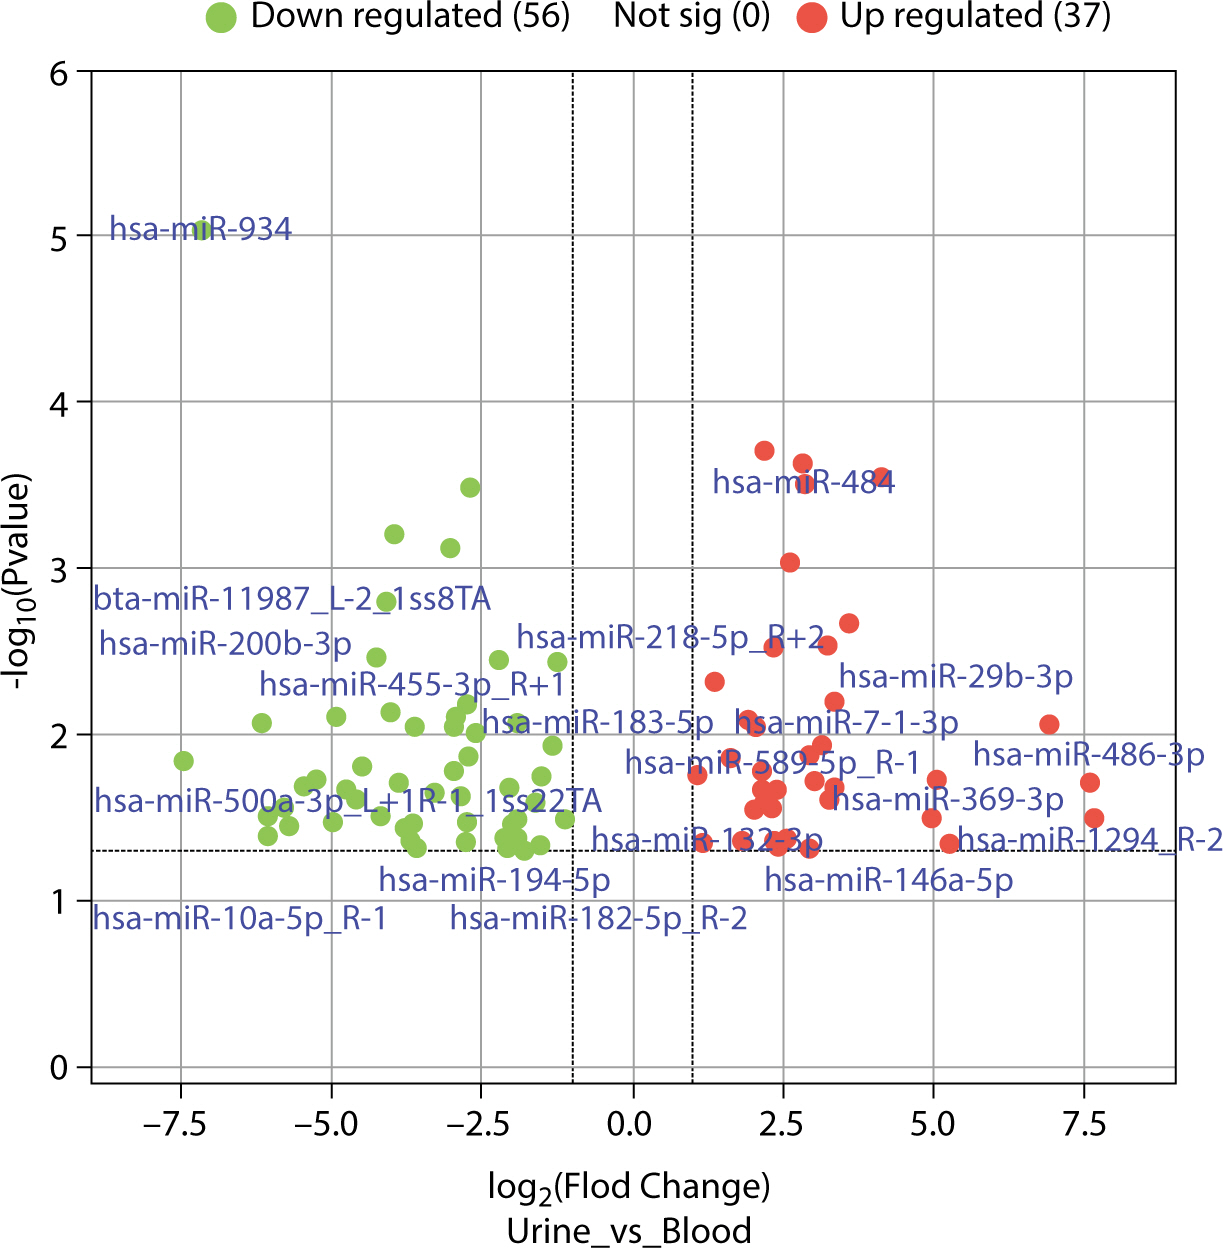
The differences in exosomal miRNAs between blood and urine were analyzed using the R language "limma" software package, identifying 102 differentially expressed miRNAs with fold changes greater than 2. Of these, 41 were more highly expressed in blood than in urine samples. The top 10 exosomal miRNAs with significant differences included hsa-miR-934, hsa-miR-30e-3p_1ss22CT, bta-miR-11987_L-1_1ss8TA, hsa-miR-10a-3p_R-1, bta-miR-11987_L-2_1ss8TA, hsa-miR-10b-5p_R-1, hsa-miR-218-5p_R+2, hsa-miR-30d-5p_R+2, hsa-miR-29c-5p_R-1, and hsa-miR-200b-3p. Conversely, 61 exosomal miRNAs were found at lower levels in blood than in urine samples, with the top 10 exosomal miRNAs showing significant differences being hsa-miR-425-5p, hsa-miR-7-5p_R-1, hsa-miR-145-5p, hsa-miR-484, hsa-miR-329-3p, hsa-miR-96-5p_R-2, hsa-miR-143-3p_R+1, hsa-miR-130b-5p_R+1, hsa-miR-140-3p_R+1, and hsa-miR-338-5p_R-1. The differentially expressed exosomal microRNAs (DEexo-miRNAs) are displayed in Fig. 6, excluding exosomal miRNAs with a log fold change (logFC) of Inf (4 instances) and -Inf (6 instances).
Fig. 6.
Volcano map of DEexo-miRNAs derived from blood and urine exosomes. DEexo-miRNAs, differentially expressed exosomal microRNAs.
Prediction of target genes for differentially expressed exosomal microRNAs
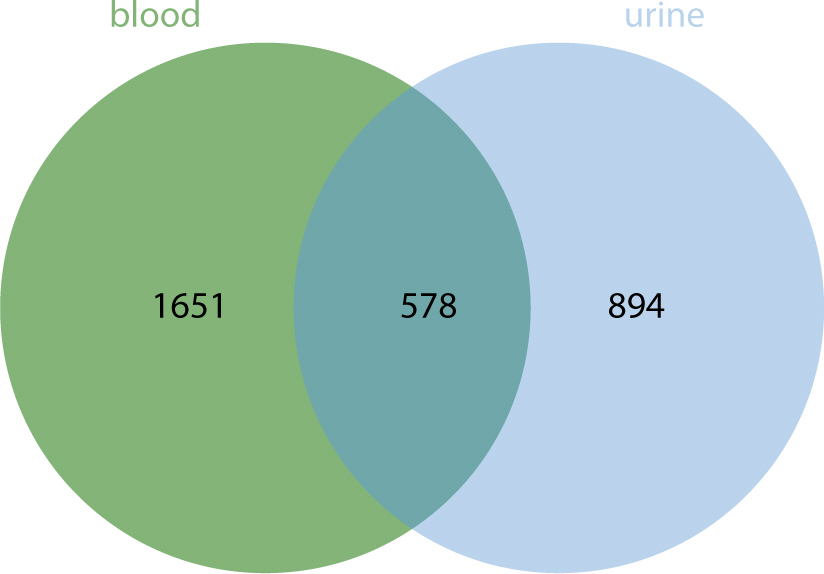
ENCORI (https://rnasysu.com/encori/) was utilized to predict the target genes (mRNA) corresponding to DEexo-miRNAs. Only those DEexo-miRNAs that matched targets in both TargetScan and Miranda were selected as the final target genes. For the top 10 DEexo-miRNAs in urine, 1,472 target mRNAs were identified, including DDX3Y, RERE, DFFA, RSRP1, PUM1, C1orf216, STK40, YRDC, RRAGC, RAB3B, CC2D1B, ZRANB2, EVI5, ARHGAP29, CLCC1, SORT1, SLC16A1, NRAS, SV2A, GATAD2B, and others. Similarly, for the top 10 DEexo-miRNAs in blood, 2,229 target mRNAs were obtained, including IFFO2, STMN1, FOXJ3, CTSS, RNF11, SRSF11, ATP1B1, LARP4B, AP3M1, TM9SF3, PTEN, LCOR, TIMM10, KMT5B, CREBZF, GNS, HSPB8, EFNB2, CFL2, and POMT2, among others. A total of 578 identical target mRNAs corresponding to DEexo-miRNAs were found between blood and urine (Fig. 7).
Fig. 7.
Venn diagram of the target mRNAs corresponding to the top 10 differentially expressed exosomal microRNAs (DEexo-miRNAs) between urine and blood.
Enrichment analysis of target mRNA according to differentially expressed exosomal miRNAs
The target mRNAs corresponding to DEexo-miRNAs underwent Gene Ontology (GO) / Kyoto Encyclopedia of Genes and Genomes (KEGG) functional annotations. In other words, the target mRNA served as an intermediary to link exosomal miRNAs with their respective functions.
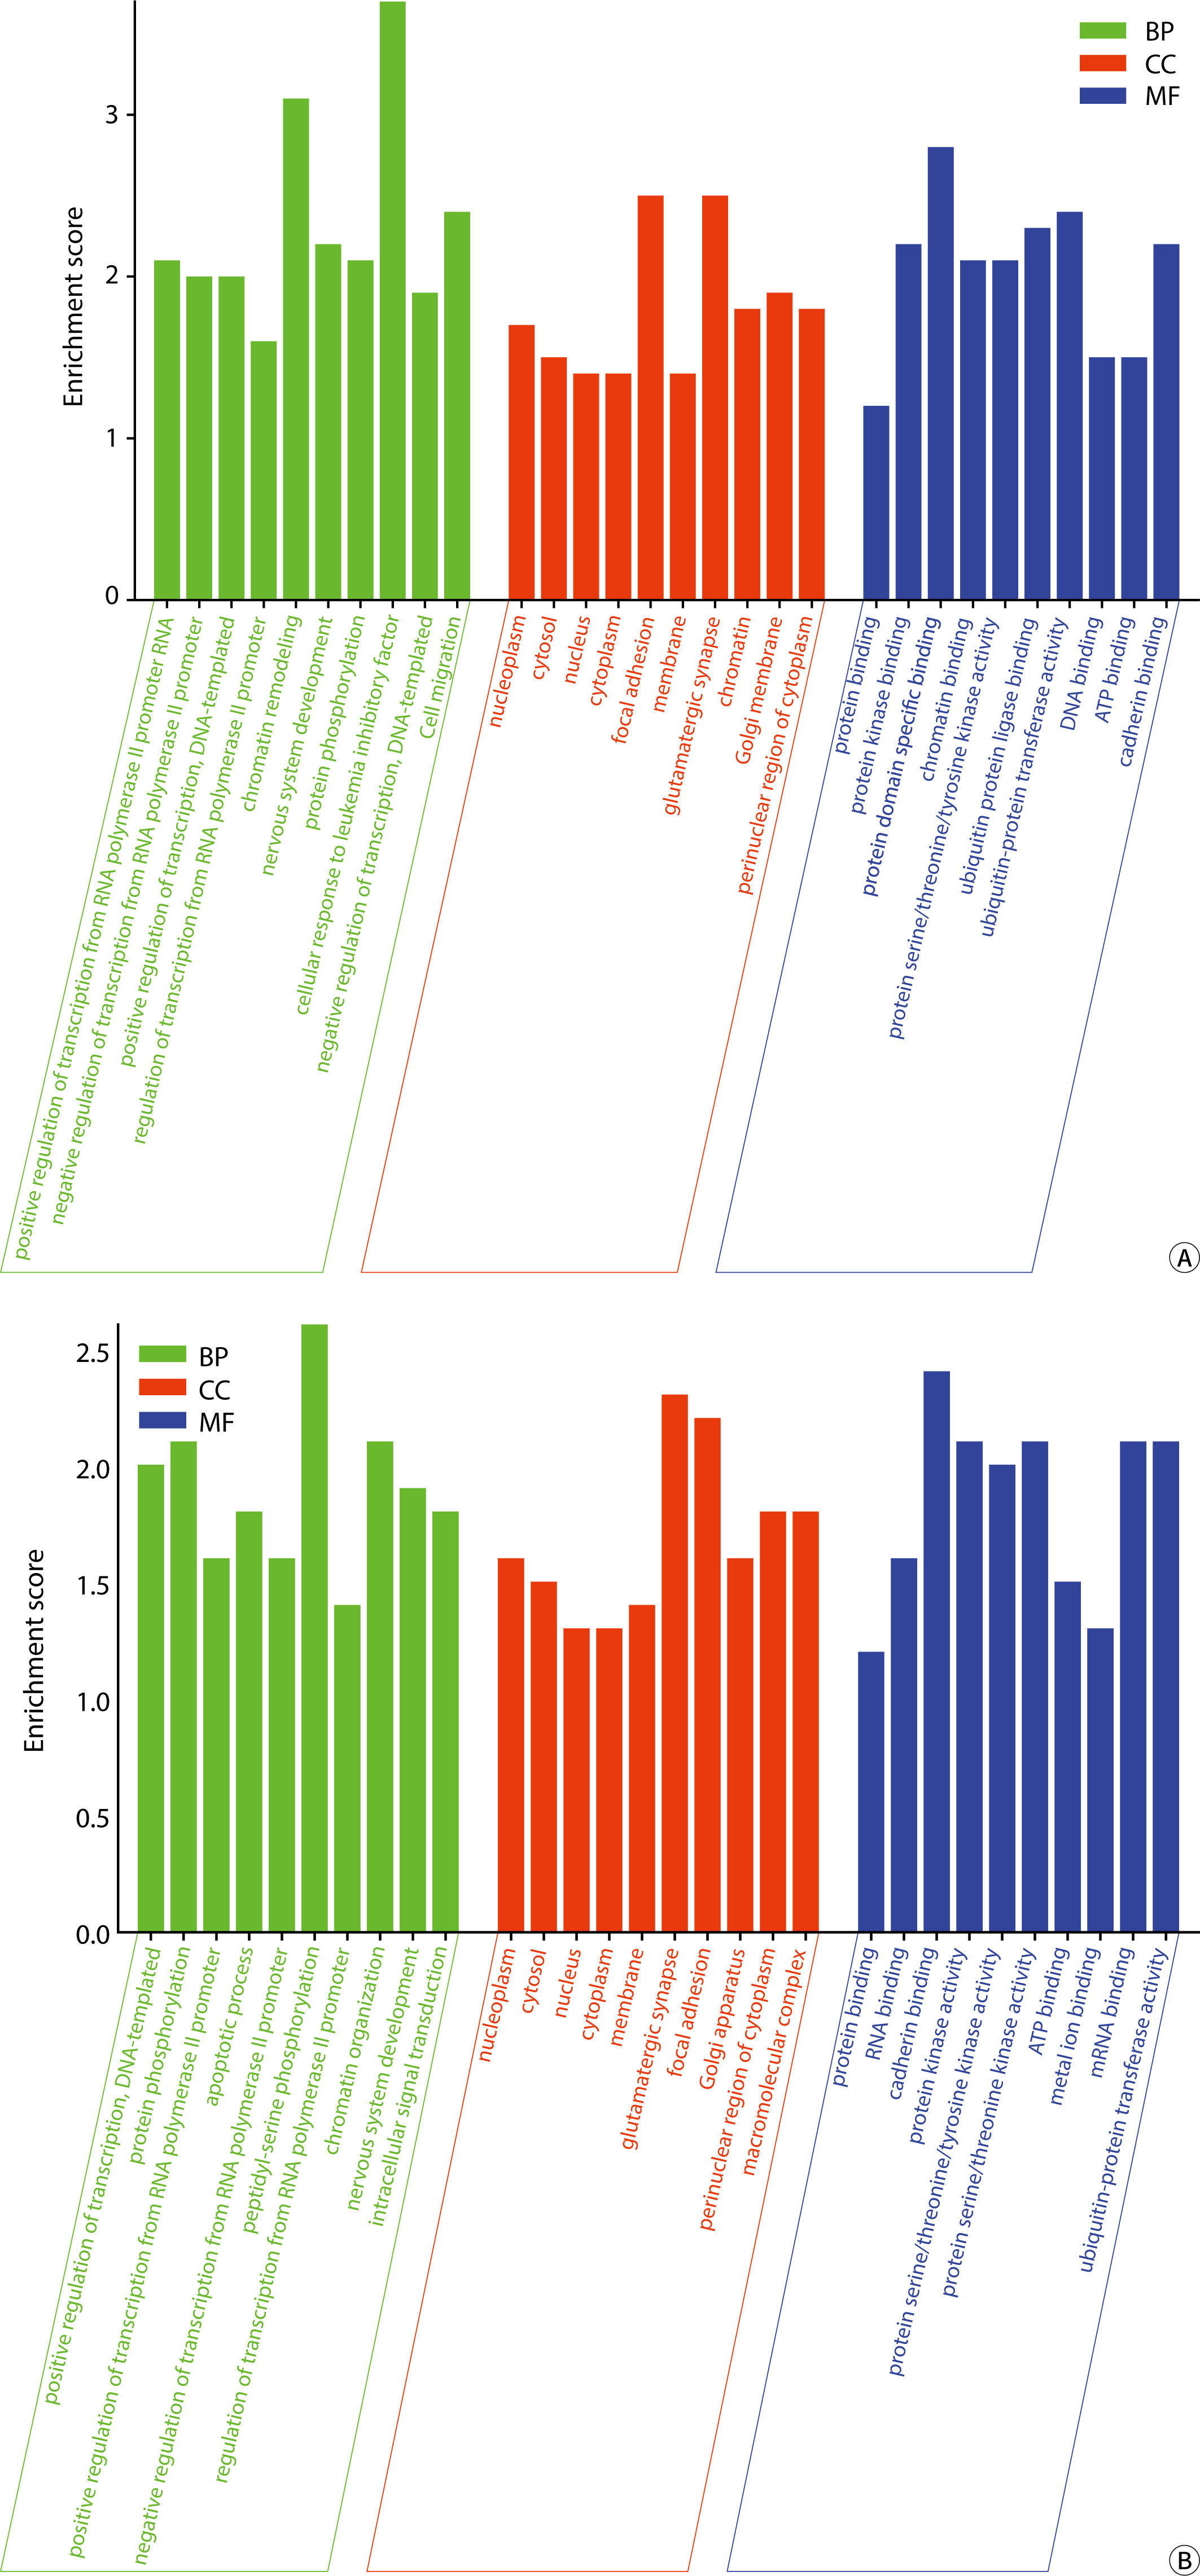
Bar chart of Gene Ontology annotations. (A) Urine, (B) blood.
The biological processes (BPs) associated with the target mRNAs of exosomal miRNA in body fluids include positive and negative regulation of RNA polymerase II promoter transcription, DNA template/promoter activities, chromatin structure modulation, nervous system development, cell migration, and protein phosphorylation/polyubiquitination, among others. The BPs influenced by the target mRNA according to DEexo-miRNAs in urine also encompass chromatin remodeling, cellular response to leukemia inhibitory factor, ubiquitination of protein at the K48 linkage, cell adhesion via plasma membrane adhesion molecules (hemophilic interactions), proteasome-mediated ubiquitin-dependent protein catabolic processes, and peptide-threonine phosphorylation. The target mRNAs of DEexo-miRNAs in blood are involved in BPs such as the apoptosis process, peptide-serine phosphorylation, intracellular signal transduction, negative regulation of gene expression, post-embryonic development, cell cycle regulation, vesicle-mediated transport, the insulin receptor signaling pathway, and protein stability.
The cellular components (CCs) associated with the target mRNAs of exosomal miRNAs in two types of body fluids included the nucleoplasm, cytosol, nucleus, cytoplasm, adhesive spots, endoplasmic reticulum membrane, glutamatergic synapse, chromatin, Golgi apparatus membrane, cytoplasmic perinuclear area, macromolecular complexes, and the actin cytoskeleton, among others. In urine, the CC of the target mRNA encompassed cytoplasmic ribonucleoprotein granules/complexes, cell-cell junctions, cell projections, ubiquitin ligase complexes, and the cytoskeleton. The target mRNAs of DEexo-miRNAs in blood were associated with CC such as intracellular membrane-bounded organelles, nuclear specks, cytoplasmic stress granules, postsynaptic densities, early endosome membranes, and chromatin.
The molecular functions (MFs) associated with the target mRNAs of exosomal miRNA in two types of humor include protein (kinase/domain-specific) binding, protein serine/threonine/tyrosine kinase activity, ubiquitin protein ligase binding/transferase activity, ATP/cadherin/RNA/GDP binding, transcription factor activity with sequence-specific DNA binding, among others. The target mRNAs of DEexo-miRNAs in urine were involved in MFs such as chromatin/DNA/β-catenin/RNA polymerase II core promoter proximal region sequence-specific DNA binding, transcription coactivator/corepressor activity, transcription activator activity, RNA polymerase II transcription regulatory region sequence-specific binding, and protein kinase inhibitor activity. Meanwhile, the target mRNA in blood was associated with MFs including protein serine/threonine kinase activity, metal ion/mRNA/protein kinase/small GTPase binding, and bridging, and others.
Kyoto Encyclopedia of Genes and Genomes enrichment
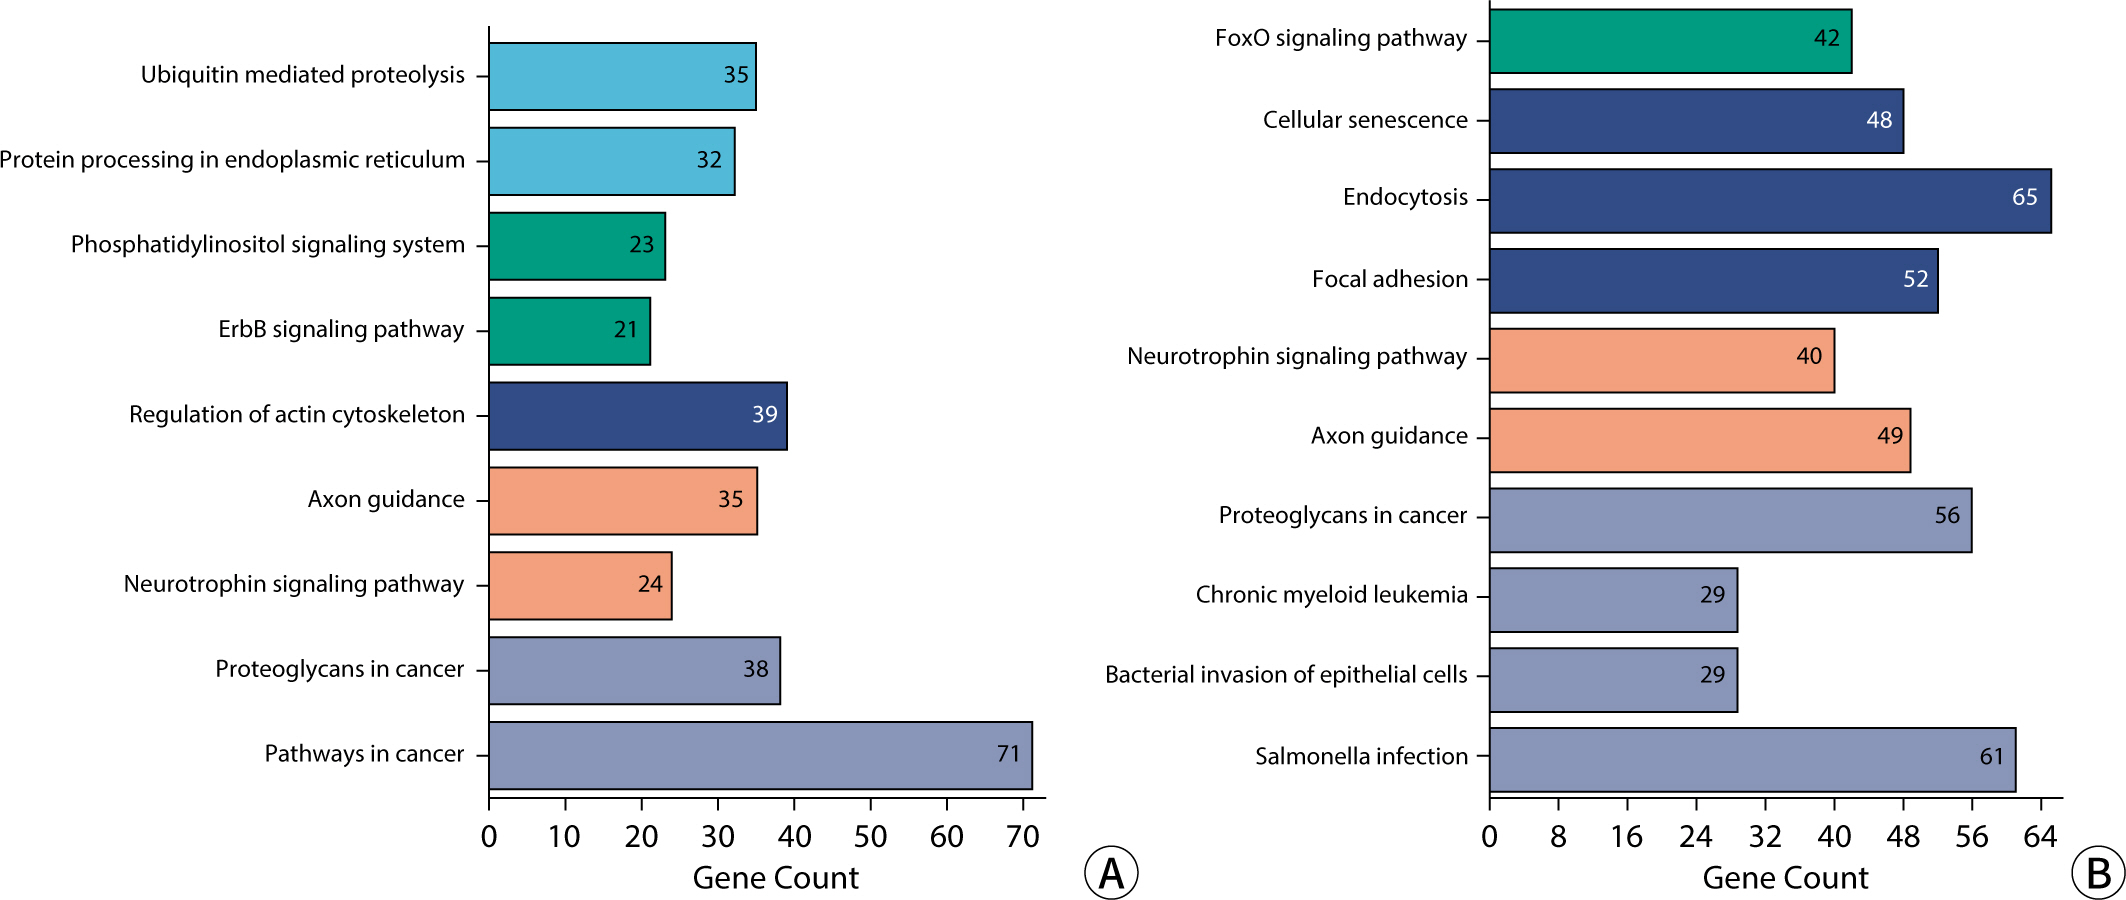
KEGG enrichment analysis revealed that the signaling pathways targeted by exosomal miRNA-associated mRNAs in blood and urine are implicated in a variety of BPs and diseases. These include proteoglycans in cancer, axonal guidance, regulation of the actin cytoskeleton, cancer pathways, resistance to EGFR tyrosine kinase inhibitors, neurotrophic signaling pathways, endocytosis, cellular adhesion sites, cellular senescence, autophagy in animals, and Salmonella infection, among others. In urine, the targeted mRNAs are involved in pathways such as ubiquitin-mediated proteolysis, the phosphatidylinositol signaling system, the ErbB/Wnt signaling pathway, protein processing in the endoplasmic reticulum, endocrine resistance, gap junction communication, oocyte meiotic division, and Shigellosis. The mRNAs targeted by DEexo-miRNAs in blood are associated with the FoxO, MAPK, PI3K-Akt, Rap1, and Ras signaling pathways, as well as with chronic myeloid leukemia, bacterial invasion of epithelial cells, hepatitis B, and Yersinia infection. The KEGG enrichment histogram is presented in Fig. 9.
Fig. 9.
The KEGG enrichment histogram. (A) Urine, (B) blood. KEGG, Kyoto Encyclopedia of Genes and Genomes.
Discussion
Blood and urine samples are commonly used for clinical testing, as they contain a variety of substances that reflect the metabolic activity of tissues and organs within an organism. In other words, detecting the same substance in different specimens, such as blood or urine, can yield different results and indicate varying conditions of the body. Therefore, distinguishing the distribution of exosomal miRNAs in different body fluids is crucial for monitoring physiological states and establishing a basis for disease diagnosis. Some studies have reported on blood and urine miRNAs within the same article [14-16]. This paper presents the comparative results for the first time, and the biological analysis of these findings is also being reported for the first time.
The study revealed that the total read counts and the total number of bases in blood and urine samples were essentially identical, and the ratios of the A, T, G, and C bases were also remarkably similar. Comparative analysis of the Rfam database indicated that the content and proportion of rRNA, snoRNA, snRNA, tRNA, and other Rfam RNAs in blood and urine exosomes were fundamentally consistent.
The comparative analysis of the Repbase database revealed that the content and proportion of total reads and unique reads for various genetic elements—including CR1, DNA_transposon, Endogenous_Retrovirus, ERV1, ERV2, ERV3, Gypsy, hAT, Ingi, L1, LTR_Retrotransposon, Male-specific_DNA, Mariner/Tc1, OOREP1, MER22, MSAT, RTE, RTEX, R4, SAT, Satellite, SINE, SINE1/7SL, SINE2/tRNA, SINE3/5S, snRNA, Transposable_Element, and tRNA—in blood and urine exosomes were largely consistent. However, the total reads for L1 were higher in urine exosomes than in blood, although the unique reads showed no difference. The length distributions of candidate RNA exhibited variations between groups at lengths of 20-23 and 25, 26, as well as in the valid unique reads. There were no significant differences in total reads between blood and urine exosomes.
The analysis of DEexo-miRNAs revealed that 41 miRNAs were more highly expressed in blood samples than in urine, while 61 miRNAs showed lower levels in blood compared to urine. The top 10 exosomal miRNAs with higher expression in blood were hsa-miR-934, hsa-miR-30e-3p_1ss22CT, bta-miR-11987_L-1_1ss8TA, hsa-miR-10a-3p_R-1, bta-miR-11987_L-2_1ss8TA, hsa-miR-10b-5p_R-1, hsa-miR-218-5p_R+2, hsa-miR-30d-5p_R+2, hsa-miR-29c-5p_R-1, and hsa-miR-200b-3p. Conversely, the top 10 miRNAs with lower expression in blood included hsa-miR-425-5p, hsa-miR-7-5p_R-1, hsa-miR-145-5p, hsa-miR-484, hsa-miR-329-3p, hsa-miR-96-5p_R-2, hsa-miR-143-3p_R+1, hsa-miR-130b-5p_R+1, hsa-miR-140-3p_R+1, and hsa-miR-338-5p_R-1. These miRNAs correspond to 1,651 and 894 types of mRNA, respectively, with 578 types being common to both groups.
Studies have found that photosensitive aminotransferase 1 (PSAT1) is a target gene for hsa-miR-218-5p and hsa-miR-145-5p, which can be used to predict bone metastasis in gastric cancer [17]. Frørup et al. discovered that extracellular vesicles, particularly those enriched in the plasma exosomes of lactating mothers with Type 1 diabetes, contained abnormal levels of hsa-miR-30d-5p post-delivery [18]. Wu et al. identified plasma exosomal miR-103b, miR-877-5p, and miR-29c-5p as diagnostic biomarkers for early lung adenocarcinoma by combining bioinformatics with experimental verification [19]. Chen et al. reported the upregulation of urinary exosomal hsa-microRNA-200b-3p and hsa-microRNA-206 in patients with steroid-induced osteonecrosis of the femoral head [20].
Sinha et al. found that hsa-miR-425-5p was significantly upregulated, while hsa-miR-663a was downregulated under diabetic conditions [21]. Deng et al. discovered that exosomes derived from the plasma of septic patients inhibited apoptosis of T lymphocytes by downregulating Bcl-2-associated death promoter via hsa-miR-7-5p [22]. Zhang et al. found that hsa-miR-145-5p was significantly differentially expressed in the serum exosomes of patients with polycystic ovarian syndrome (PCOS) and considered these miRNAs as potential biomarkers for PCOS [23]. Hang et al. argued that the downregulation of miR-145-5p in cancer cells and their derived exosomes may contribute to the development of ovarian cancer by targeting connective tissue growth factor [24]. Zhao et al. revealed that the injection of RGD-modified exosomes loaded with miR-484 induced vessel normalization, which in turn sensitized cancer cells to chemotherapy-induced apoptosis [25]. Zhang et al. reported that low serum exosomal miR-484 expression predicted an unfavorable prognosis in ovarian cancer [26]. Li et al. identified cerebrospinal fluid exosomal hsa-miR-96-5p as a biomarker for diagnosing or monitoring the progression of non-small cell lung cancer with leptomeningeal metastases [27]. Tomita et al. considered urinary exosomal hsa-miR-143-3p as a predictive biomarker for persistent psychotic-like experiences [28]. Wang et al. found that hsa-miR-143-3p expression was significantly higher in exosomes from human bone marrow mesenchymal stem cells than in those from human pancreatic cancer cell line exosomes, and suggested that hsa-miR-143-3p might promote apoptosis and suppress cell growth and invasion in pancreatic cancer [29]. Ramanathan et al. detected that poor responders had lower levels of exosomal hsa-miR-338-5p and proposed exosomal hsa-miR-338-5p as a potential biomarker due to its stability and dysregulation in diseases, including complex regional pain syndrome, a chronic pain disorder with persistent inflammation [30].
The BPs associated with the target genes (mRNA) of DEexo-miRNA in blood and urine encompassed both positive and negative regulation of transcription from an RNA polymerase II promoter on a DNA template, as well as modifications to chromatin structure. The CCs involved included the nucleoplasm, cytosol, nucleus, cytoplasm, adhesive spots, and membranes. The MFs of these target genes were found to be diverse, involving protein binding (including kinase, domain-specific, serine/threonine, and tyrosine kinase interactions), ubiquitin protein ligase binding and transferase activity, as well as ATP, cadherin, GDP binding, and transcription factor activity, which includes sequence-specific DNA binding within the RNA binding transcriptional regulation region. The target mRNAs of DEexo-miRNAs in blood and urine play roles in various signaling pathways. These pathways include proteoglycans in cancer, axonal guidance, regulation of the actin cytoskeleton, cancer pathways, resistance to EGFR tyrosine kinase inhibitors, neurotrophic signaling pathways, endocytosis, attachment sites, cellular aging, autophagy in animals, and Salmonella infection.
Our analysis of blood and urine exosome sequencing revealed that the ncRNA content, including rRNA, tRNA, snoRNA, snRNA, miRNA, and other ncRNAs, was essentially identical. The database of eukaryotic DNA repeat sequences encompasses transposable elements, tandem repeat sequences (such as satellite sequences or microsatellites), scattered genomic repeat sequences, and some multicopy host genes (including rRNA, tRNA, histone genes, etc.). Additionally, the length distribution of candidate RNA (unique reads) exhibited slight variability. A total of 102 DEexo-miRNAs were identified between blood and urine, with 41 being more abundant in blood than in urine, and 61 showing higher levels in urine than in blood. The corresponding mRNAs of these miRNAs are involved in signaling pathways such as proteoglycans in cancer, axonal guidance, regulation of the actin cytoskeleton, and various cancer pathways. This study lays the groundwork for the identification of potential biomarkers derived from blood and urinary exosomes.
Authors' contributions
Conceptualization: Chun-yan L
Formal analysis: Yuan Z
Investigation: Yuan Z
Methodology: Yao H
Project administration: Chun-yan L
Writing – original draft: Yuan Z
Writing – review & editing: Chun-yan L, Yuan Z, Yao H
Conflict of interest
No potential conflict of interest relevant to this article was reported.
Funding
This work was supported by the Department of Science and Technology Key R&D projects in Sichuan Provincial (grant number: 2022YFS0200). Open access funding provided by Chengdu University.
Data availability
Not applicable.
Acknowledgments
Not applicable.
Supplementary materials
Not applicable.
References
1. Fabian MR, Sonenberg N, Filipowicz W. Regulation of mRNA translation and stability by microRNAs. Annu Rev Biochem 2010;79:351-379.
2. Gupta J, Tayyib NA, Jalil AT, Hlail SH, Zabibah RS, Vokhidov UN, et al. Angiogenesis and prostate cancer: microRNAs comes into view. Pathol Res Pract 2023;248:154591
3. Khordadmehr M, Matin R, Baradaran B, Baghbani E, Jigari-Asl F, Noorolyai S. The effect of miR-4800 restoration on proliferation and migration of human breast cancer cells in vitro. Adv Pharm Bull 2023;13(2):378-384.
4. García-Sánchez D, González-González A, Alfonso-Fernández A, Del Dujo-Gutiérrez M, Pérez-Campo FM. Communication between bone marrow mesenchymal stem cells and multiple myeloma cells: impact on disease progression. World J Stem Cells 2023;15(5):421-437.
5. Yuan Y, Rao LZ, Zhang SH, Xu Y, Li TT, Zou J, et al. Exercise regulates bone metabolism via microRNAs. Acta Physiol Sin 2023;75(3):429-438.
6. de Matos BM, Stimamiglio MA, Correa A, Robert AW. Human pluripotent stem cell-derived extracellular vesicles: from now to the future. World J Stem Cells 2023;15(5):453-465.
7. Yuan YG, Wang JL, Zhang YX, Li L, Reza AMMT, Gurunathan S. Biogenesis, composition and potential therapeutic applications of mesenchymal stem cells derived exosomes in various diseases. Int J Nanomed 2023;18:3177-3210.
8. Jiang X, Zhang Z, Hou M, Yang X, Cui L. Plasma exosomes and contained MiRNAs affect the reproductive phenotype in polycystic ovary syndrome. FASEB J 2023;37(7):e22960.
11. Lv C, Xu Y, Wang Y, Ding W, Yao D, Zhao Z, et al. Comparative analysis of urinary sediments and extracellular RNA in patients with renal fibrosis. Guangdong Med 2020;41(15):1567-1572.
12. Lv C, Wang Y, Ding W. Effective isolation of urinary exosomes by novel approach: polyethylene glycol precipitation. Chin J Biochem Mol Biol 2018;34(1):110-116.
13. Lv C, Ding W, Wang Y, Zhao Z, Li J, Chen Y, et al. A PEG-based method for the isolation of urinary exosomes and its application in renal fibrosis diagnostics using cargo miR-29c and miR-21 analysis. Int Urol Nephrol 2018;50(5):973-982.
14. Yu C, Zhang M, Xiong Y, Wang Q, Wang Y, Wu S, et al. Comparison of miRNa transcriptome of exosomes in three categories of somatic cells with derived iPSCs. Sci Data 2023;10(1):616
15. Perez-Hernandez J, Riffo-Campos AL, Ortega A, Martinez-Arroyo O, Perez-Gil D, Olivares D, et al. Urinary- and plasma-derived exosomes reveal a distinct microRNA signature associated with albuminuria in hypertension. Hypertension 2021;77(3):960-971.
17. Ma J, Zhu M, Ye X, Wu B, Wang T, Ma M, et al. Prognostic microRNAs associated with phosphoserine aminotransferase 1 in gastric cancer as markers of bone metastasis. Front Genet 2022;13:959684
18. Frørup C, Mirza AH, Yarani R, Nielsen LB, Mathiesen ER, Damm P, et al. Plasma exosome-enriched extracellular vesicles from lactating mothers with type 1 diabetes contain aberrant levels of mirNAS during the postpartum period. Front Immunol 2021;12:744509
19. Wu J, Feng Z, Wang R, Li A, Wang H, He X, et al. Integration of bioinformatics analysis and experimental validation identifies plasma exosomal miR-103b/877-5p/29c-5p as diagnostic biomarkers for early lung adenocarcinoma. Cancer Med 2022;11(23):4411-4421.
20. Chen D, Zhang G, Li Y, Zhang M, He Q, Yang J, et al. Up-regulation of urinary exosomal hsa-microRNA-200b-3p and hsa-microRNA-206 in patients of steroid-induced osteonecrosis of femoral head. Am J Transl Res 2021;13(7):7574-7590.
21. Sinha N, Puri V, Kumar V, Nada R, Rastogi A, Jha V, et al. Urinary exosomal miRNA-663a shows variable expression in diabetic kidney disease patients with or without proteinuria. Sci Rep 2023;13(1):4516
22. Deng J, Li YQ, Liu Y, Li Q, Hu Y, Xu JQ, et al. Exosomes derived from plasma of septic patients inhibit apoptosis of T lymphocytes by down-regulating bad via hsa-miR-7-5p. Biochem Biophys Res Commun 2019;513(4):958-966.
23. Zhang F, Li S, Zhang T, Yu B, Zhang J, Ding H, et al. High throughput microRNAs sequencing profile of serum exosomes in women with and without polycystic ovarian syndrome. PeerJ 2021;9:e10998.
24. Hang W, Feng Y, Sang Z, Yang Y, Zhu Y, Huang Q, et al. Downregulation of miR-145-5p in cancer cells and their derived exosomes may contribute to the development of ovarian cancer by targeting CT. Int J Mol Med 2019;43(1):256-266.
25. Zhao Z, Shuang T, Gao Y, Lu F, Zhang J, He W, et al. Targeted delivery of exosomal miR-484 reprograms tumor vasculature for chemotherapy sensitization. Cancer Lett 2022;530:45-58.
26. Zhang W, Su X, Li S, Liu Z, Wang Q, Zeng H. Low serum exosomal miR-484 expression predicts unfavorable prognosis in ovarian cancer. Cancer Biomark 2020;27(4):485-491.
27. Li H, Xia M, Zheng S, Lin Y, Yu T, Xie Y, et al. Cerebrospinal fluid exosomal microRNAs as biomarkers for diagnosing or monitoring the progression of non-small cell lung cancer with leptomeningeal metastases. Biotechnol Genet Eng Rev 2023 Feb 28 [Epub].
29. Wang B, Xu Y, Wei Y, Lv L, Liu N, Lin R, et al. Human mesenchymal stem cell-derived exosomal microRNA-143 promotes apoptosis and suppresses cell growth in pancreatic cancer via target gene regulation. Front Genet 2021;12:581694
30. Ramanathan S, Douglas SR, Alexander GM, Shenoda BB, Barrett JE, Aradillas E, et al. Exosome microRNA signatures in patients with complex regional pain syndrome undergoing plasma exchange. J Transl Med 2019;17(1):81
Detection and characterization of alterations in miRNA in urine of firefighters Patrick C Sachs, Julie S Bjerring, James Blando, Robert D Bruno Toxicological Sciences.2026;[Epub] CrossRef
Liquid Biopsy-Based Metabolomics in Epithelial Ovarian Cancer: Challenges, Methodological Advances and Translational Considerations Mariagrazia D’Agostino, Luna Laera, Martina Lanza, Doron Tolomeo, Monica Montopoli, Clelia Tiziana Storlazzi, Gennaro Cormio, Alessandra Castegna, Stefano Miglietta Diagnostics.2026; 16(13): 1983. CrossRef
Potential liquid biopsy markers of exosomal microRNAs in renal interstitial fibrosis blood and urine Chunyan Lv, Yuan Zhong, Yao Hu, Yan Tang Indian Journal of Pathology and Microbiology.2025; 68(2): 279. CrossRef
Gender equity in medical journals in Korea and this issue Sun Huh The Ewha Medical Journal.2024;[Epub] CrossRef
Exosomal microRNAs (miRNAs) in blood and urine under physiological conditions: a comparative study
Fig. 1.
Identification of exosomes. (A) Electron microscopy of exosomes: the typical single concave tea tray-shaped structure of exosomes (bar=200 nm). (B) Detection of exosomes using a nanoparticle size analyzer: particle aggregation peak with a diameter of approximately 110 nm.
Fig. 2.
Pie charts displaying the proportions of rRNA, snoRNA, snRNA, tRNA and some other non-miRNA sequences, referring to the Rfam database. (A,B) Statistics and visualization in total read; (A) blood, (B) urine. (C,D) Statistics and visualization for unique read; (C) blood, (D) urine. miRNA, microRNA; rRNA, ribosomal RNA; tRNA, transfer RNA; snoRNA, small nucleolar RNA; snRNA, small nuclear RNA.
Fig. 3.
Stacked graphs presenting a comparison of the two types of data based on the Repbase database. (A) Total reads (%), (B) unique reads (%).
Fig. 4.
Length distribution of the sequencing results. (A) Total reads (%), (B) unique reads (%).
Fig. 5.
Correlation analysis of gene expression between three blood samples and three urine samples.
Fig. 6.
Volcano map of DEexo-miRNAs derived from blood and urine exosomes. DEexo-miRNAs, differentially expressed exosomal microRNAs.
Fig. 7.
Venn diagram of the target mRNAs corresponding to the top 10 differentially expressed exosomal microRNAs (DEexo-miRNAs) between urine and blood.
Fig. 8.
Bar chart of Gene Ontology annotations. (A) Urine, (B) blood.
Fig. 9.
The KEGG enrichment histogram. (A) Urine, (B) blood. KEGG, Kyoto Encyclopedia of Genes and Genomes.
Fig. 1.
Fig. 2.
Fig. 3.
Fig. 4.
Fig. 5.
Fig. 6.
Fig. 7.
Fig. 8.
Fig. 9.
Exosomal microRNAs (miRNAs) in blood and urine under physiological conditions: a comparative study
The basic information of six healthy individuals
Age
Sex
BMI (kg/m2)
FBG (mmol/L)
hs-CRP (mg/L)
Urinary pH value
Urine specific gravity
36
Male
22
4.95
9.45
6.5
1.010
27
Female
20
4.80
2.33
6.0
1.015
42
Male
23
6.00
8.55
7.0
1.012
35
Female
23
5.33
3.44
7.5
1.020
23
Male
20
3.98
1.67
5.3
1.024
58
Female
27
6.00
9.88
4.8
1.023
BMI, body mass index; FBG, fasting blood glucose; hsCRP, high-sensitivity C-reactive protein.
Databases used in the experiment
Database
Web address
Version date
miRNA (miRs) database
ftp://miRBase.org/pub/miRBase/CURRENT/
22.0
Pre-miRNA (mirs/MIRs) database
ftp://miRBase.org/pub/miRBase/CURRENT/
22.0
RFam
Collection of many common non-coding RNA families other than miRNA http://rfam.janelia.org
12.0
Repbase
Prototypic sequences representing repetitive DNA from different eukaryotic species http://www.girinst.org/repbase
miRNA, microRNA; KEGG, Kyoto Encyclopedia of Genes and Genomes.
Quality control results of miRNA sequencing data from blood and urine exosome
Sample_ID
Total_Reads
Total_Bases
A%
T%
C%
G%
Q20%
Q30%
GC%
Urine exosomes
27,871,527.67±5,722,347.37
1,421,447,911±291,839,716
23.87±1.80
23.98±1.03
22.49±0.63
29.67±2.18
99.05±0.34
96.98±0.75
52.15±2.31
Blood exosomes
25,884,881.33±11,374,109.12
1,320,128,948±580,079,565
23.24±0.75
24.01±0.91
23.56±0.86
29.18±0.81
97.87±2.63
95.77±3.60
52.74±0.18
P-value
0.8003
0.8003
0.6056
0.9717
0.1571
0.7336
0.4839
0.5992
0.6820
Q20% reflects the quality of the data, indicating that in the sequencing results, the probability of a base error at a certain position caused by the sequencing instrument is less than 1%; Q30% indicates that in the sequencing results, the probability of a base error at a certain position caused by the sequencing instrument is less than 0.1%.
miRNA, microRNA.
Rfam category statistics of blood and urine exosomes
Library
Total reads
Unique reads
Blood
Urine
P-value
Blood
Urine
P-value
rRNA
664,436.33±89,892.42
716,135.67±420,629.50
0.8453
16,146.67±4,995.21
11,825.67±1,730.40
0.2298
tRNA
619,247.33±409,943.55
367,148.33±284,480.43
0.4309
9,178.00±5,089.72
6,175.00±3,168.85
0.4346
snoRNA
56,828.33±75,016.46
21,599±12,498.19
0.4673
500.00±357.22
457.33±238.68
0.8718
snRNA
48,305.67±49,710.85
46,866±24,310.35
0.9662
479.67±267.73
491.00±226.30
0.9580
Other Rfam RNA
311,030.67±229,410.06
302,926±103,992.12
0.9582
3,579.33±1,690.04
3,382.00±1,622.64
0.8911
rRNA, ribosomal RNA; tRNA, transfer RNA; snoRNA, small nucleolar RNA; snRNA, small nuclear RNA.
Repbase database category data of blood and urine exosomes
Type
Total reads
Unique reads
Blood
Urine
P-value
Blood
Urine
P-value
CR1
158.33±105.29
460.67±391.79
0.2663
7.00±2.65
11.33±3.21
0.1458
DNA_transposon
5.33±5.51
23.67±40.99
0.4854
0.67±0.58
0.67±1.15
1.0000
Endogenous_Retrovirus
631.67±203.29
1,172.67±617.80
0.2230
22.00±12.53
35.00±14.80
0.3101
ERV1
7,303.00±3,428.55
12,029.67±9,812.39
0.4749
147.00±75.43
233.67±69.74
0.2178
ERV2
1,541.33±861.59
2,453.67±819.99
0.2547
34.67±10.60
63.67±24.95
0.1375
ERV3
1,729.67±1,011.16
6,242.33±7,672.87
0.3697
35.67±15.14
59.67±39.55
0.3819
Gypsy
20.33±28.57
2.00±3.46
0.3318
1.00±1.00
0.33±0.58
0.3739
hAT
375.67±385.70
70.00±19.47
0.2423
12.00±9.85
5.67±0.58
0.3285
Ingi
16.33±18.23
0
0.1956
1.00±1.00
0
0.1583
L1
1,314.67±642.18
4,333.33±1,739.74
0.0479
55.00±27.07
160.00±123.48
0.2236
LTR_Retrotransposon
498.33±695.27
582.33±121.84
0.8468
13.67±13.87
11.33±4.04
0.7935
Male-specific_DNA
127.33±200.12
2.00±3.46
0.3391
1.67±2.08
0.33±0.58
0.3453
Mariner/Tc1
1,027.00±1,099.83
197.33±118.89
0.2638
24.67±23.01
19.67±10.07
0.7476
OOREP1
12.33±21.36
0
0.3739
0.33±0.58
0
0.3739
MER22
0
126.00±124.53
0.1546
0
2.00±1.73
0.1161
MSAT
0
4.00±6.93
0.3739
0
0.67±1.15
0.3739
RTE
0
2.67±4.62
0.3739
0
0.33±0.58
0.3739
RTEX
0
7.33±12.70
0.3739
0
0.67±1.15
0.3739
R4
5.67±9.81
4.33±7.51
0.8608
0.33±0.58
0.33±0.58
1.0000
SAT
190.33±153.05
291.33±438.60
0.7256
4.33±2.52
5.00±4.58
0.8360
Satellite
21.67±21.03
17.67±26.39
0.8474
2.00±2.65
2.00±2.65
1.0000
SINE
2,050.33±1,447.02
7,130.00±10,174.03
0.4402
22.33±13.80
95.67±138.26
0.4124
SINE1/7SL
1,392.33±946.64
12,243.67±18,914.70
0.3772
63.33±54.24
419.67±605.41
0.3673
SINE2/tRNA
14,275.67±6,922.48
85,443.00±114,958.14
0.3448
147.33±68.85
252.67±147.75
0.3257
SINE3/5S
3,721.33±2,783.05
1,386.33±1,270.52
0.2567
82.33±20.50
71.33±57.36
0.7701
snRNA
1,824.67±2,724.41
0
0.3106
7.00±7.21
0
0.1680
Transposable_Element
223.33±220.37
71.33±14.57
0.2991
6.00±2.65
3.67±0.58
0.2099
tRNA
60.67±60.35
19.00±28.69
0.3409
2.33±1.53
0.67±0.58
0.1518
Length distribution of the sequencing results of blood and urine exosomes
Length
Total reads
Unique reads
Blood
Urine
P-value
Blood
Urine
P-value
18
436,361.00±143,478.88
993,080.67±471,516.15
0.1220
50,807.33±28,024.14
109,079.33±36,787.36
0.0945
19
663,565.67±221,921.31
1,328,995.33±611,193.97
0.1509
55,624.00±32,124.51
136,549.00±40,863.32
0.0543
20
1,352,551.67±801,446.33
1,802,782.33±729,445.32
0.5116
57,068.00±31,853.45
154,423.67±51,343.34
0.0493
21
2,530,332.00±1,624,499.74
2,050,522.67±649,025.54
0.6595
57,933.00±30,115.17
161,037.00±55,019.65
0.0465
22
3,577,806.00±2,569,496.50
3,027,407.00±996,219.06
0.7468
53,488.00±27,137.48
149,230.67±48,943.87
0.0414
23
1,448,801.67±815,249.61
2,050,510.33±642,210.98
0.3721
46,007.00±21,993.58
131,136.33±48,280.39
0.0499
24
673,059.33±364,409.83
1,636,292.33±663,391.86
0.0922
39,495.67±16,834.52
118,143.67±48,698.24
0.0574
25
428,329.00±284,580.69
877,942.00±586,115.02
0.2980
25,034.33±7,529.50
90,539.00±31,209.68
0.0241
26
267,313.67±139,584.21
563,885.33±246,623.50
0.1441
18,557.33±3,910.05
69,582.33±16,221.38
0.0061
Valid reads
11,378,120.00±5,998,577.15
14,331,418.00±3,925,298.36
0.5149
404,014.67±193,601.66
1,119,721.00±350,791.92
0.0364
Table 1.
The basic information of six healthy individuals
BMI, body mass index; FBG, fasting blood glucose; hsCRP, high-sensitivity C-reactive protein.
Table 2.
Databases used in the experiment
miRNA, microRNA; KEGG, Kyoto Encyclopedia of Genes and Genomes.
Table 3.
Quality control results of miRNA sequencing data from blood and urine exosome
Q20% reflects the quality of the data, indicating that in the sequencing results, the probability of a base error at a certain position caused by the sequencing instrument is less than 1%; Q30% indicates that in the sequencing results, the probability of a base error at a certain position caused by the sequencing instrument is less than 0.1%.
miRNA, microRNA.
Table 4.
Rfam category statistics of blood and urine exosomes
rRNA, ribosomal RNA; tRNA, transfer RNA; snoRNA, small nucleolar RNA; snRNA, small nuclear RNA.
Table 5.
Repbase database category data of blood and urine exosomes
Table 6.
Length distribution of the sequencing results of blood and urine exosomes