Abstract
-
Objectives:
This study aimed to develop an accurate pediatric bone age prediction model
by utilizing deep learning models and contrast conversion techniques, in
order to improve growth assessment and clinical decision-making in clinical
practice.
-
Methods:
The study employed a variety of deep learning models and contrast conversion
techniques to predict bone age. The training dataset consisted of pediatric
left-hand X-ray images, each annotated with bone age and sex information.
Deep learning models, including a convolutional neural network , Residual
Network 50 , Visual Geometry Group 19, Inception V3, and Xception were
trained and assessed using the mean absolute error (MAE). For the test data,
contrast conversion techniques including fuzzy contrast enhancement,
contrast limited adaptive histogram equalization (HE) , and HE were
implemented. The quality of the images was evaluated using peak
signal-to-noise ratio (SNR), mean squared error, SNR, coefficient of
variation, and contrast-to-noise ratio metrics. The bone age prediction
results using the test data were evaluated based on the MAE and root mean
square error, and the t-test was performed.
-
Results:
The Xception model showed the best performance (MAE=41.12). HE exhibited
superior image quality, with higher SNR and coefficient of variation values
than other methods. Additionally, HE demonstrated the highest contrast among
the techniques assessed, with a contrast-to-noise ratio value of 1.29.
Improvements in bone age prediction resulted in a decline in MAE from 2.11
to 0.24, along with a decrease in root mean square error from 0.21 to
0.02.
-
Conclusion:
This study demonstrates that preprocessing the data before model training
does not significantly affect the performance of bone age prediction when
comparing contrast-converted images with original images.
-
Keywords: Bone age measurement; X-ray image; Deep learning
Introduction
Background
Heterogeneity in skeletal maturation is influenced by a complex interplay of
factors, including genetic predispositions, the nutritional and growth status of
the child, the onset of precocious puberty, hormonal variations, conditions
related to pediatric endocrinology and metabolic disorders, and ailments
affecting the musculoskeletal system [
1-
3]. The assessment of bone
age, especially through methods that examine growth plates, is crucial not only
for identifying precocious puberty and providing benchmarks for growth
trajectories and future height predictions but also for managing conditions such
as adolescent idiopathic scoliosis and determining the appropriate timing for
orthopedic interventions in children with skeletal anomalies [
3-
6].
Thus, the appraisal of bone age using standardized methods is paramount for
diagnosing, managing, and developing effective therapeutic strategies for these
conditions.
Conventional methods for determining bone age in children, such as cervical
vertebral maturation, the Roche-Wainer-Thissen criterion for knee assessment,
and Risser’s sign for evaluating the iliac crest apophysis, are
supplemented by more commonly used techniques like the Greulich and Pyle (GP)
and Tanner Whitehouse (TW3) methods, which utilize radiographic images of the
left hand. The GP method provides a straightforward way to estimate bone age by
comparing the bony structures of the hand and wrist with a sex-specific
collection of images that depict various stages of skeletal maturity. However,
its accuracy can be compromised in cases of significant skeletal deformities,
with the range of evaluative intervals in the image collection spanning from six
months to a year. In contrast, the Tanner-Whitehouse (TW) approach assigns
grades from A to I to each bone in the targeted area, comparing them to a
standard dataset and aggregating these maturity scores to predict bone age.
While the TW method is known for its complexity and precision, offering enhanced
reliability, it also requires a more substantial time commitment [
1,
7].
The reliability of both GP and TW assessments depends on the subjective
interpretation by radiologists, which can lead to variability in outcomes based
on the evaluator's expertise [
2,
6]. This highlights the
clinical need for more accurate and time-efficient methods for determining bone
age. Recent advancements have led to the development of automated bone age
assessment techniques that utilize AI technology, with commercial AI-based
software solutions like BoneXpert and VUNO now available for clinical use. These
innovations represent a significant shift towards more precise and dependable
bone age assessment protocols.
Despite these technological advances, challenges remain, particularly in
analyzing images affected by suboptimal quality or unusual skeletal structures.
Furthermore, there is a significant lack of discussion concerning the
effectiveness of post-processing techniques in conventional growth plate
analyses.
Objectives
This study aims to address these gaps by exploring methods to enhance image
contrast, thereby improving the accuracy of region of interest classification
and contributing to the advancement of bone age assessment technologies.
Methods
Ethics statement
This study is based on publicly available, anonymous X-ray image data; therefore,
approval by the institutional review board and the requirement for informed
consent were exempted.
Study design
This was a methodological study to predict values in model training for bone
age.
Study procedure
In this study, we used training and validation data that had been preprocessed
and normalized, utilizing Light hand X-ray images and comma-separated values
(CSV) file-type labels for model training. We employed several models, including
a convolutional neural network (CNN), Residual Network 50 (ResNet 50), Visual
Geometry Group (VGG) 19, Inception V3, and Xception. To derive the predicted
values for the test images, we stored the weight value corresponding to the
smallest validation loss observed during the model training. The resulting
values were saved in a comma-separated values file, and we evaluated each model
by comparing the root mean square error (RMSE) values.
Data sources
The data used in this study were obtained from the dataset released during the
2017 RSNA AI Pediatric Bone Age Challenge (Dataset 1), which was created by
Stanford University and the University of Colorado and annotated by multiple
expert observers. This dataset includes a total of 126,111 pediatric left-hand
X-ray images, each labeled with the subject's sex and bone age. The age
range of the subjects in these images spans from 1 month to 228 months and
comprises 6,833 male and 5,778 female subjects. All data feature normalized
resolution and have not been processed. Additionally, the data were collected in
a multi-institutional setting, with labeling performed collaboratively by two
pediatric radiologists from each institution.
Table 1 shows specific details regarding the 2017 RSNA AI Pediatric
Bone Age Challenge dataset. Data generated and/or analyzed during the current
study are available in Dataset 2.
Table 1.Description of the 2017 RSNA pediatric bone age challenge
dataset
|
Items |
Description |
|
Imaging modality |
X-ray
Preferred name: digital
radiography
RadLex ID: RID10351 |
|
Annotation pattern |
Whole study label |
|
Annotation methodology and
structure |
Method of annotation
-
Manual
Annotation output
- Spreadsheet
(alphanumeric)
Storage, Portability,
Interoperability
- Downloadable ZIP file (RSNA
website) |
|
Imaging file/structure set format |
Portable Network Graphic (PNG) |
|
Image characteristics |
Resolution
-
Normalized
Preprocessing
- None |
|
Labeler demographics |
Scope of annotation:
multi-institutional
- Two pediatric radiologists from
each institution clinical report |
Preprocessing and augmentation
For the model training phase, 100,888 images, representing 80% of the total
126,111 images in the dataset, were used for training. The remaining 20%, or
25,123 images, were set aside for validation. The testing procedures utilized a
subset of 100 images. Additionally, all images were resized to a resolution of
256×256 pixels in RGB format, and processing was carried out in batches
of 32, using a random seed of 42 to ensure consistency. The training images
underwent augmentation through vertical flipping, a technique used to increase
data diversity and improve the model's generalization performance.
Training and evaluation
The Adam optimizer was used as the optimization function, and mean absolute error
(MAE) served as the evaluation metric. The model underwent 50 epochs, each
consisting of 300 steps, and it was subjected to both training and validation
processes. These processes were essential for monitoring validation loss to
determine the model's optimal performance, which was achieved when the
loss value was at its minimum. The loss value and MAE from the validation phase
confirmed the learning verification for each model on a monthly basis.
The formula for MAE is as follows:
n is the number of samples or data points,
yi represents the actual or observed value, and
yi' represents the predicted
value.
The comparison of performance evaluations across models was shown as the
distribution of differences between the labeled age and the predicted age.
Image contrast conversion and quantitative analysis
Contrast conversion procedures were conducted on 100 test datasets. Three
distinct algorithms were employed for contrast adjustment: fuzzy contrast
enhancement (FCE), histogram equalization (HE), and contrast limited adaptive
histogram equalization (CLAHE). The FCE algorithm enhances image contrast by
applying principles of fuzzy logic. This method involves fuzzifying the pixel
intensities and then defuzzifying the resulting fuzzy set. The formal expression
for the FCE algorithm is articulated as follows:
The conventional HE technique employs histogram equalization to enhance contrast.
This algorithm involves calculating the histogram of the input image, followed
by deriving the cumulative distribution function. Afterward, histogram
normalization is performed, and the cumulative distribution function is used to
adjust the pixel values in the image.
Conversely, the CLAHE algorithm utilizes a contrast-constrained adaptive HE
approach to enhance image contrast. This method divides the image into discrete,
small blocks, applying HE independently to each one. Contrast constraints are
applied to improve the contrast within each image segment. Subsequently, all
blocks are combined to produce the final image.
To assess the image quality of the contrast-transformed image, we analyzed
several metrics, including the peak signal-to-noise ratio (PSNR), mean squared
error (MSE), signal-to-noise ratio (SNR), coefficient of variation (COV), and
contrast-to-noise ratio (CNR). The formulas for each metric are as follows.
Mp is the maximum possible pixel value, and MSE is
the mean squared error between the original and distorted images.
A and B are the dimensions of the image.
I(i,j) and
K(i,j) are the pixel
intensities of the original and distorted images, respectively.
SP represents the strength of the desired information in the image. NP represents
the level of unwanted background noise in the image.
M represents the average contrast level in the image. SD denotes the variability
or dispersion of noise within the image.
MC represents the average contrast level in the image.
Image contrast conversion and quantitative analysis
A comprehensive assessment was conducted using 100 test sets to calculate the MAE
and RMSE, thereby evaluating the accuracy of bone age estimation for each
contrast-converted image. MAE was calculated according to
Equation (1), and RMSE according
to
Equation (8).
n is the number of samples or data points,
yi represents the actual or observed value, and
yi' represents the predicted
value.
Statistical methods
The statistical significance of the findings was assessed using the t-test, with
the predetermined threshold for statistical significance established at
P<0.05.
Results
Subjects’ characteristics
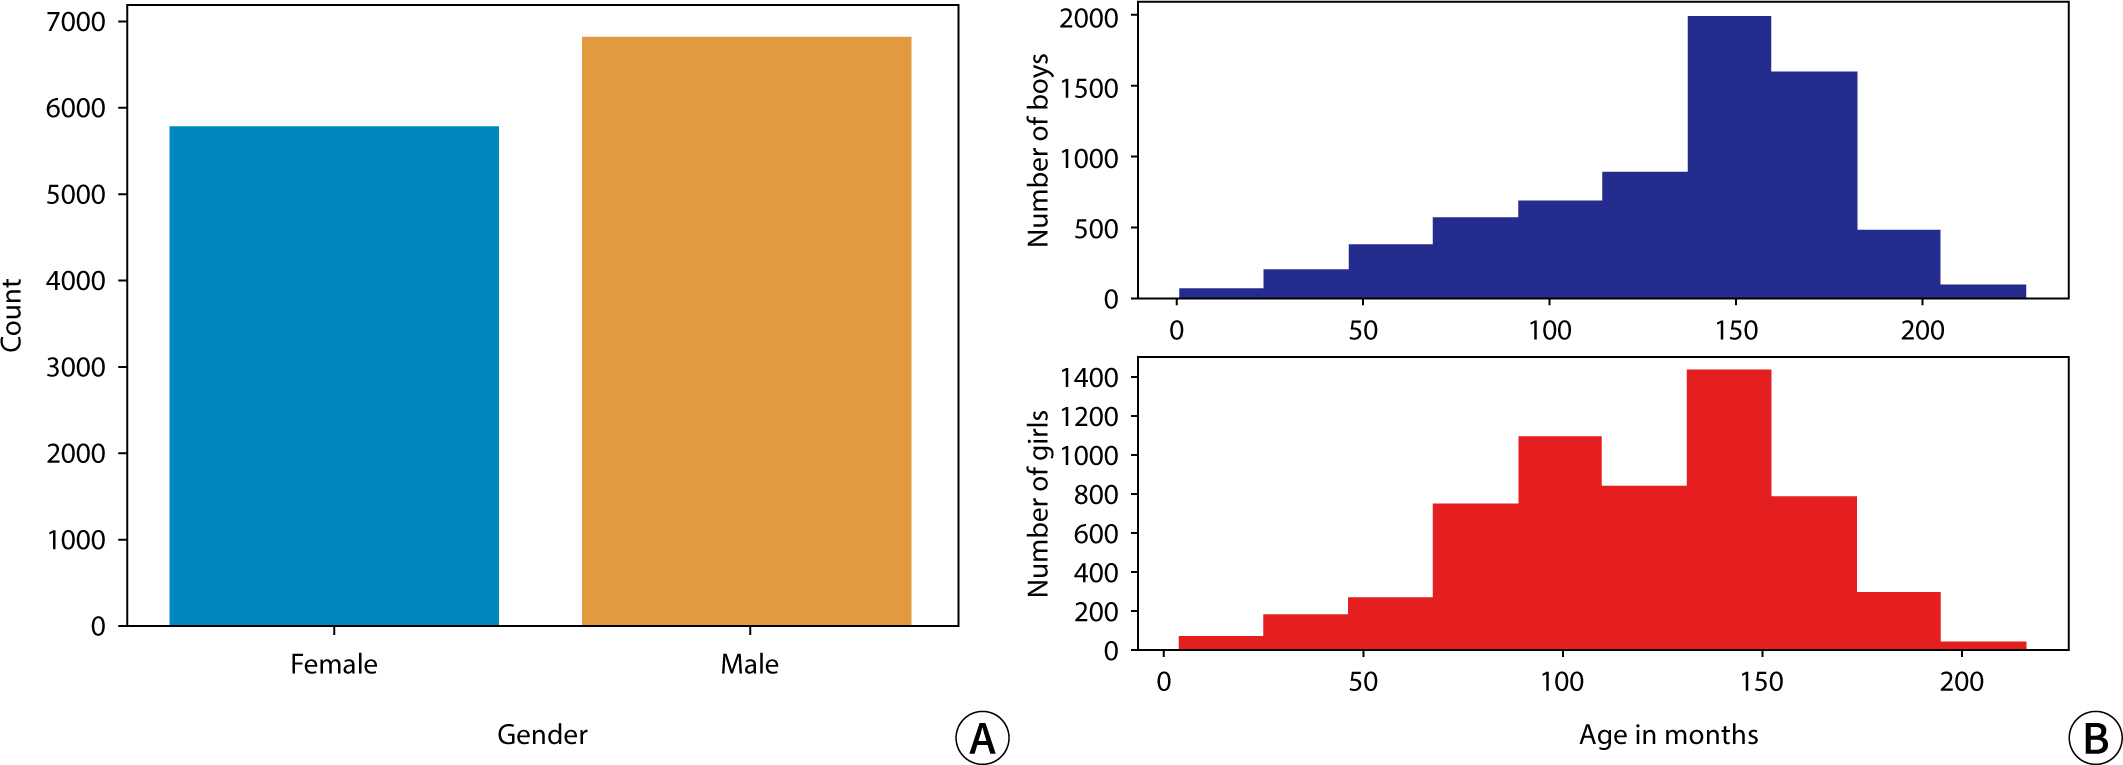
The sex distribution of subjects and the monthly age distribution for males and
females in this study are presented in
Fig.
1.
Fig. 1.Histograms depicting (A) the sex distribution and (B) the monthly age
distribution for males and females.

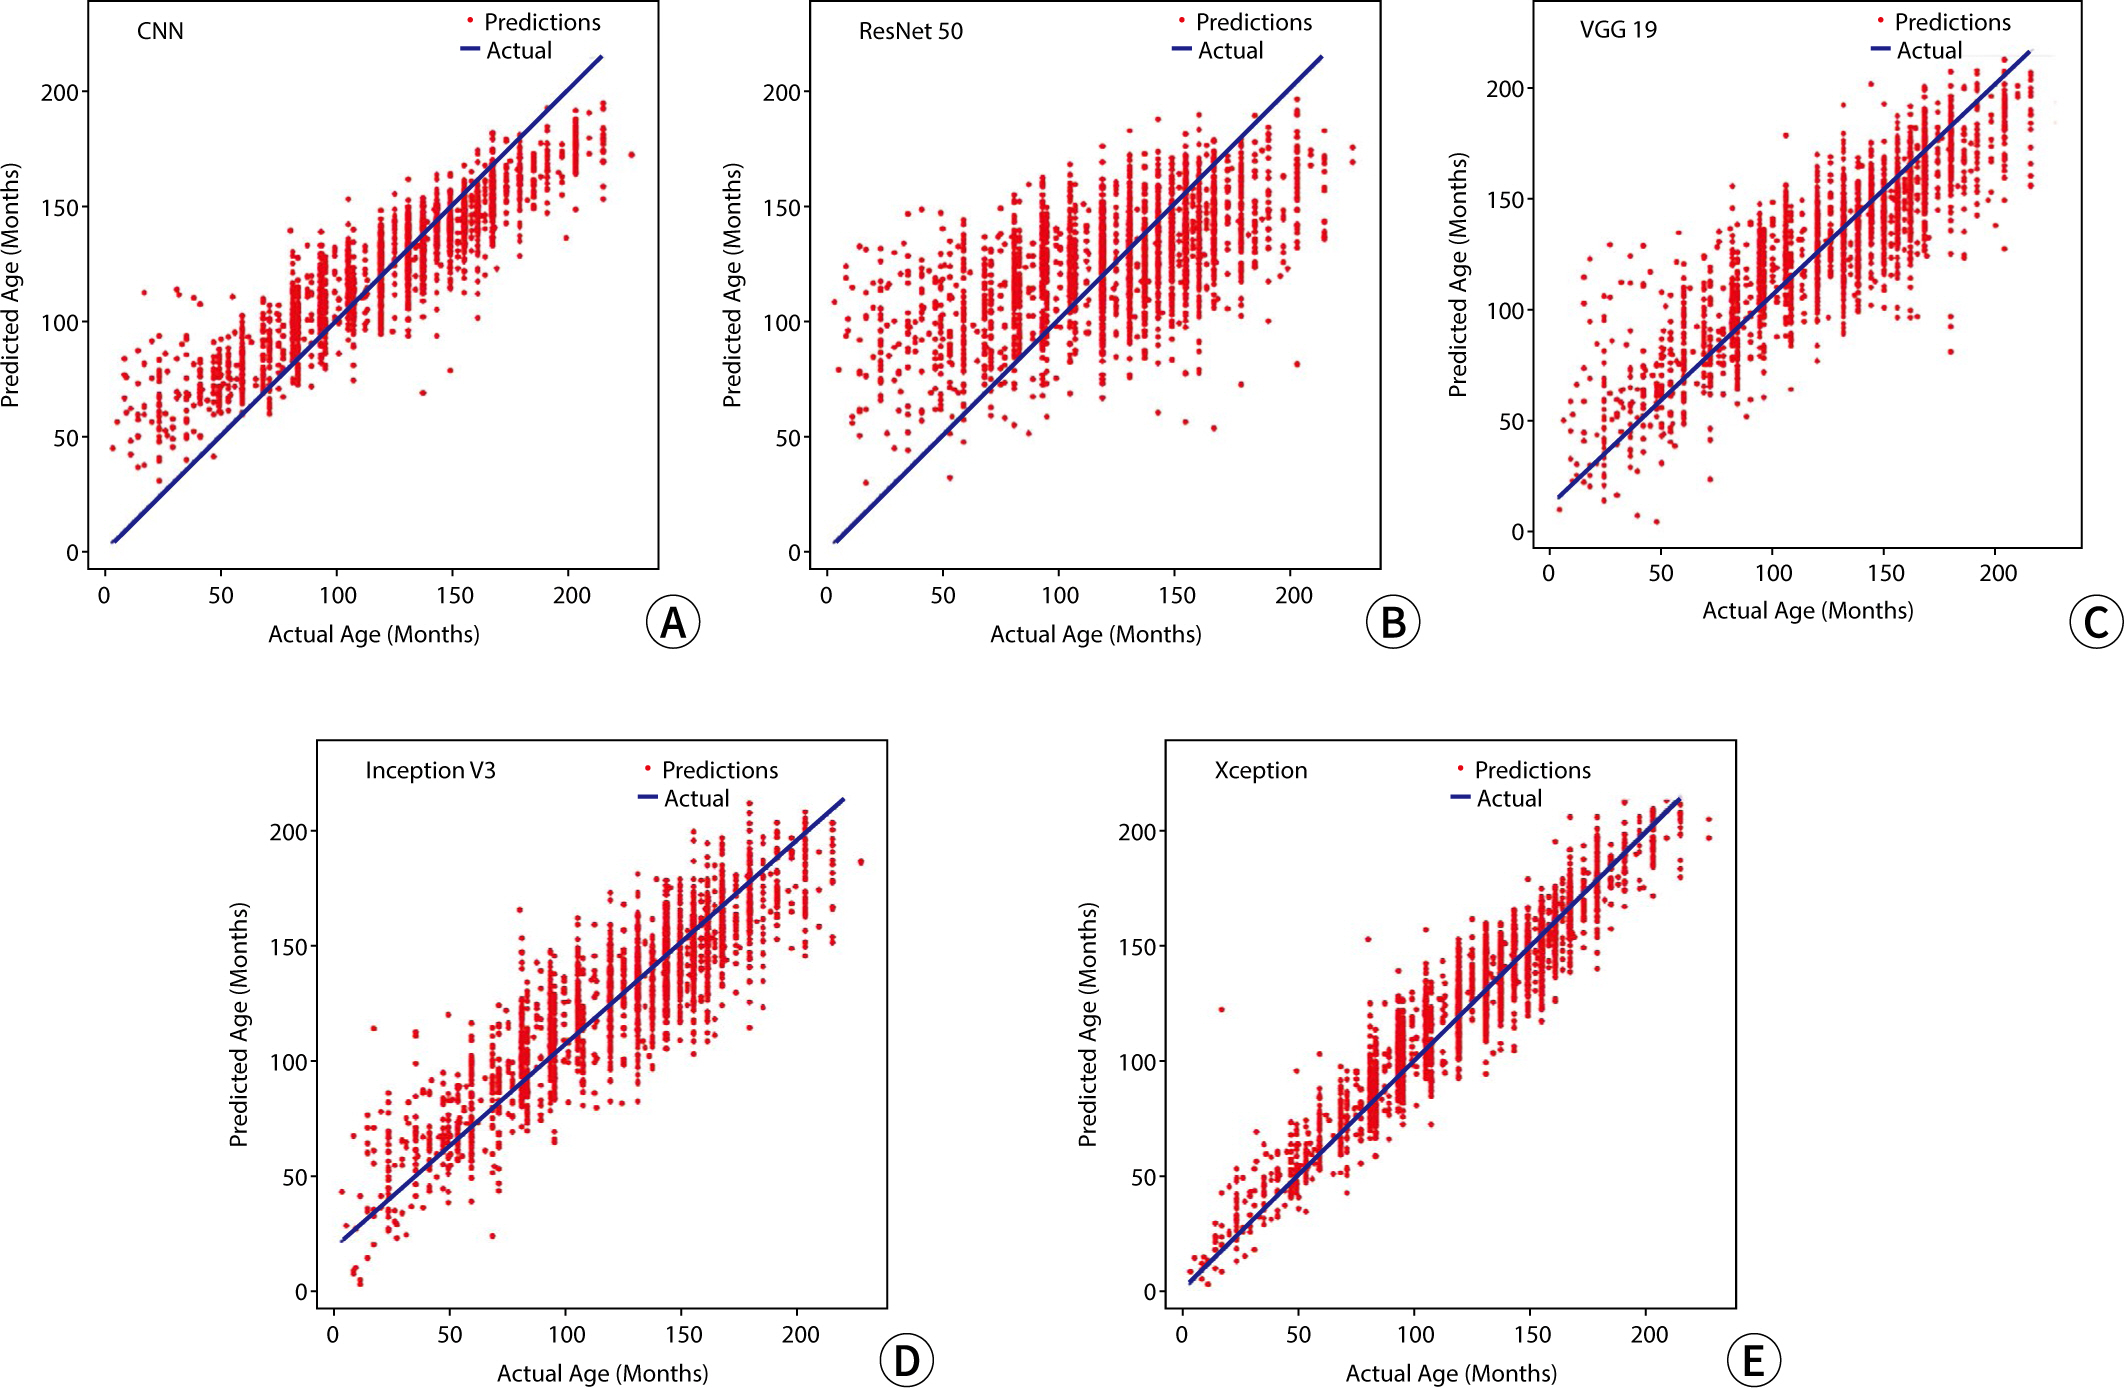
Model performance
The RMSE values for the predicted bone age relative to the actual age, used as
metrics to assess model performance in the study, were 50.91 for CNN, 55.29 for
ResNet 50, 50.29 for VGG 19, 48.74 for Inception V3, and 41.12 for Xception. A
graphical representation illustrating the outcomes of bone age prediction in
relation to chronological age is shown in
Fig.
2.
Fig. 2.Comparison of bone age and model predictions. (A) CNN, (B) ResNet 50,
(C) VGG 19, (D) Inception V3, and (E) Xception. The blue line represents
the actual bone age, while the red dot represents the predicted result.
CNN, convolutional neural network; ResNet 50, Residual Network 50; VGG
19, Visual Geometry Group 19.
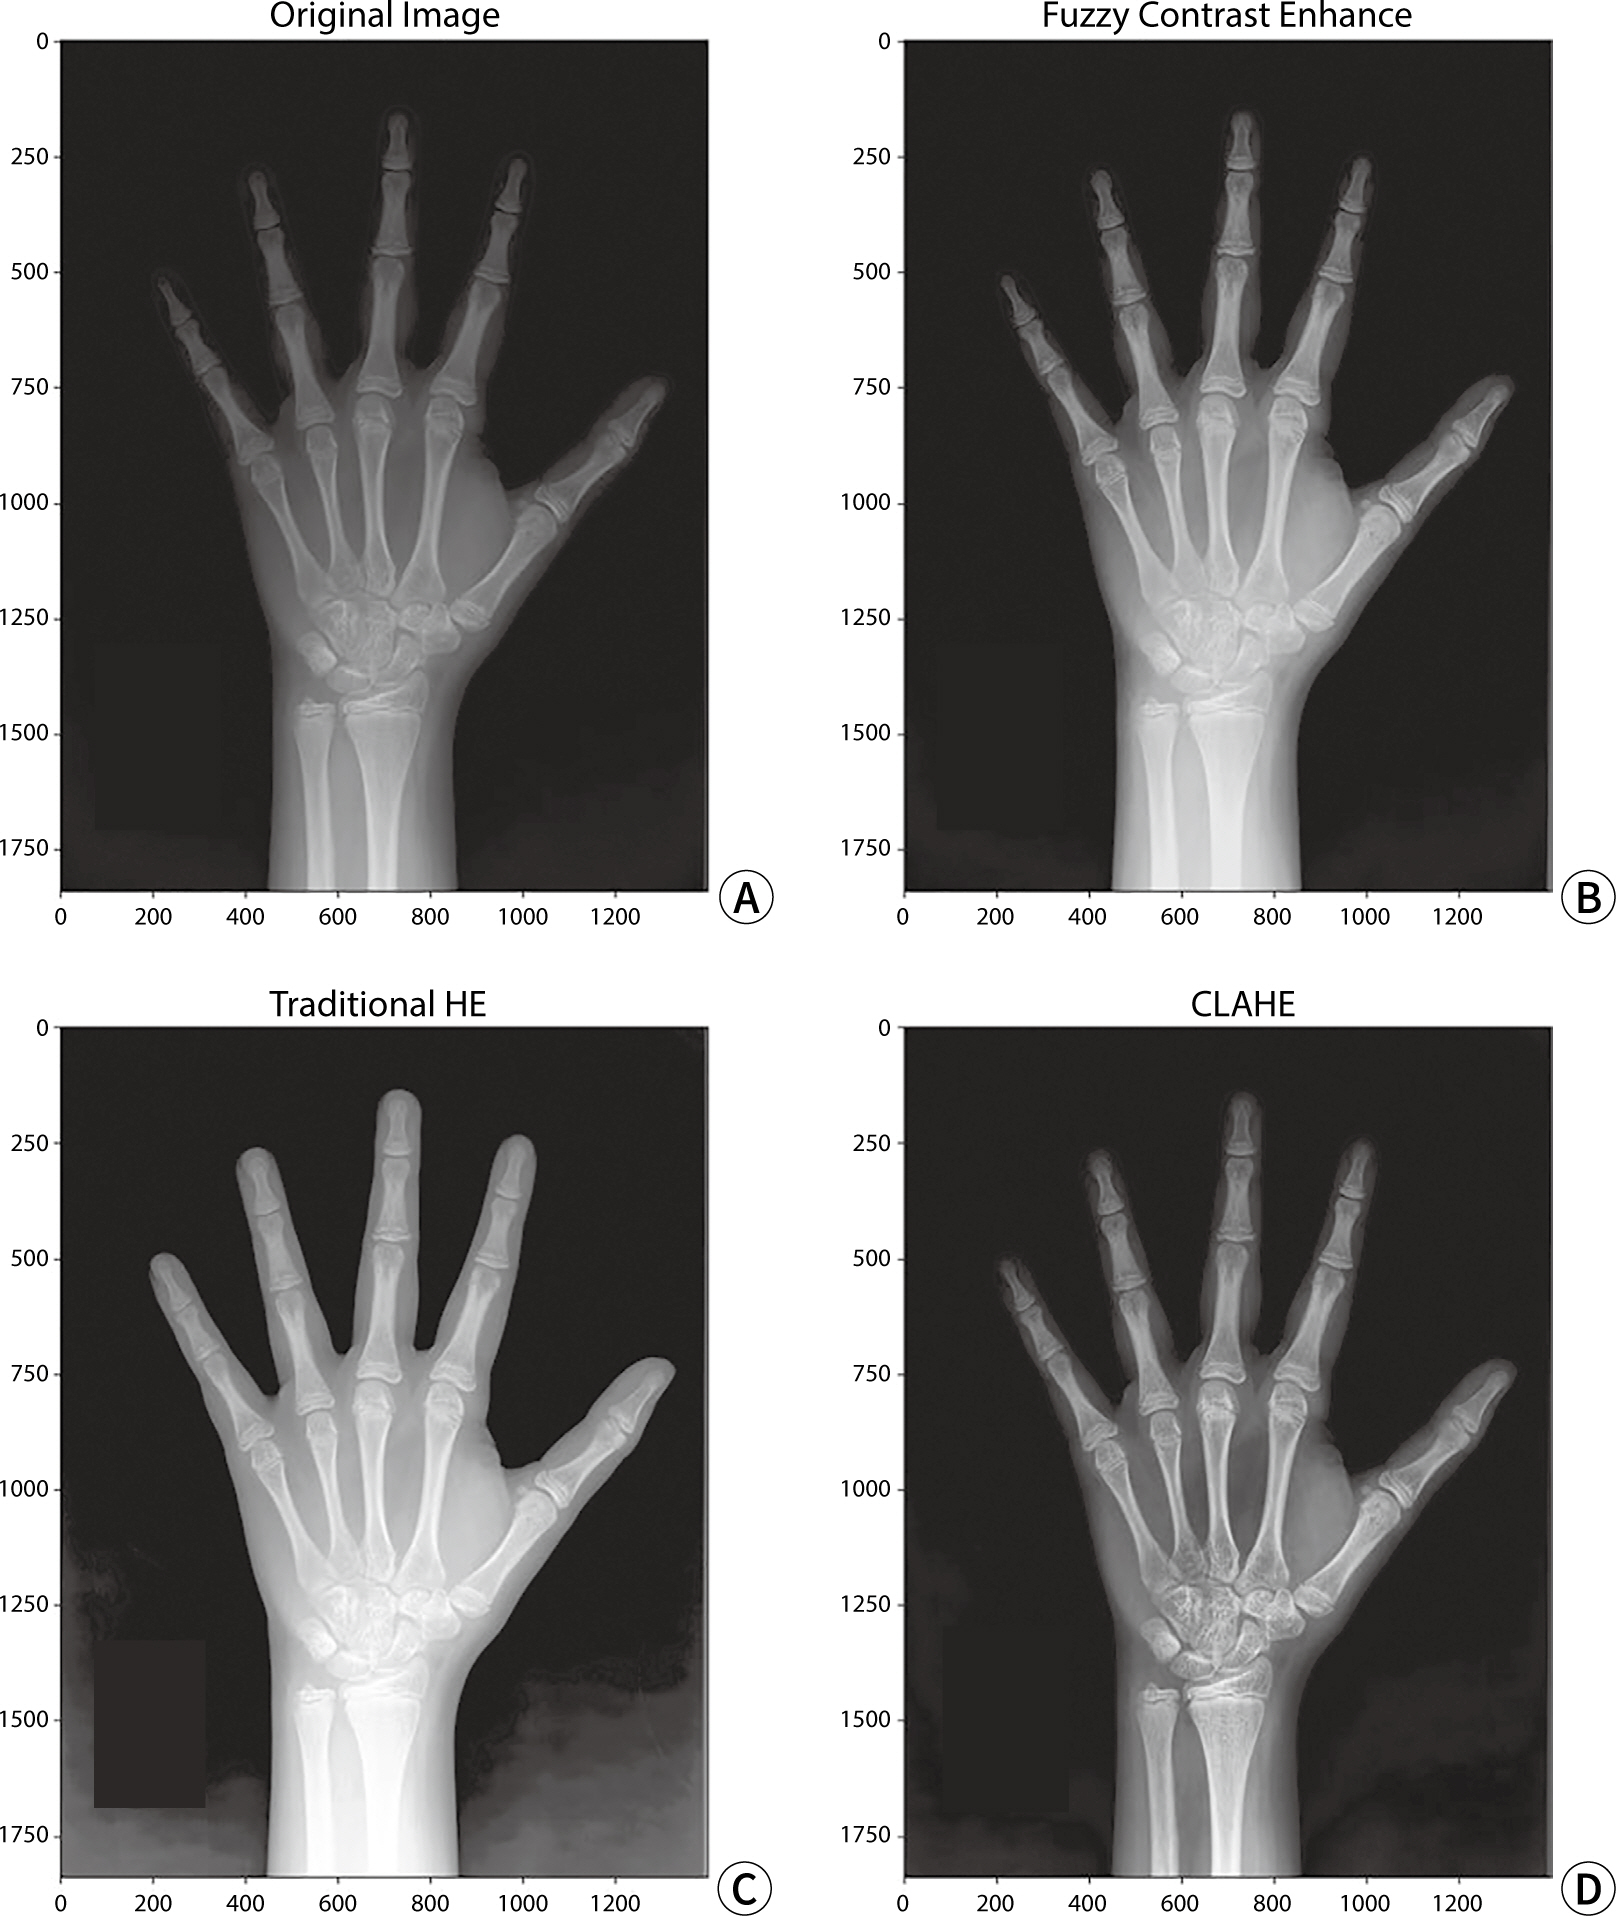
X-ray image contrast conversion
CLAHE, FCE, and HE were individually applied to the test data for model
evaluation to perform contrast transformation. An example of a contrast-enhanced
image is shown in
Fig. 3.
Fig. 3.The original left-hand X-ray image and the image after applying each
contrast conversion algorithm. (A) Original image, (B) FCE algorithm
applied, (C) HE algorithm applied, (D) CLAHE algorithm applied. HE,
histogram equalization; CLAHE, contrast limited adaptive histogram
equalization; FCE, fuzzy contrast enhancement.
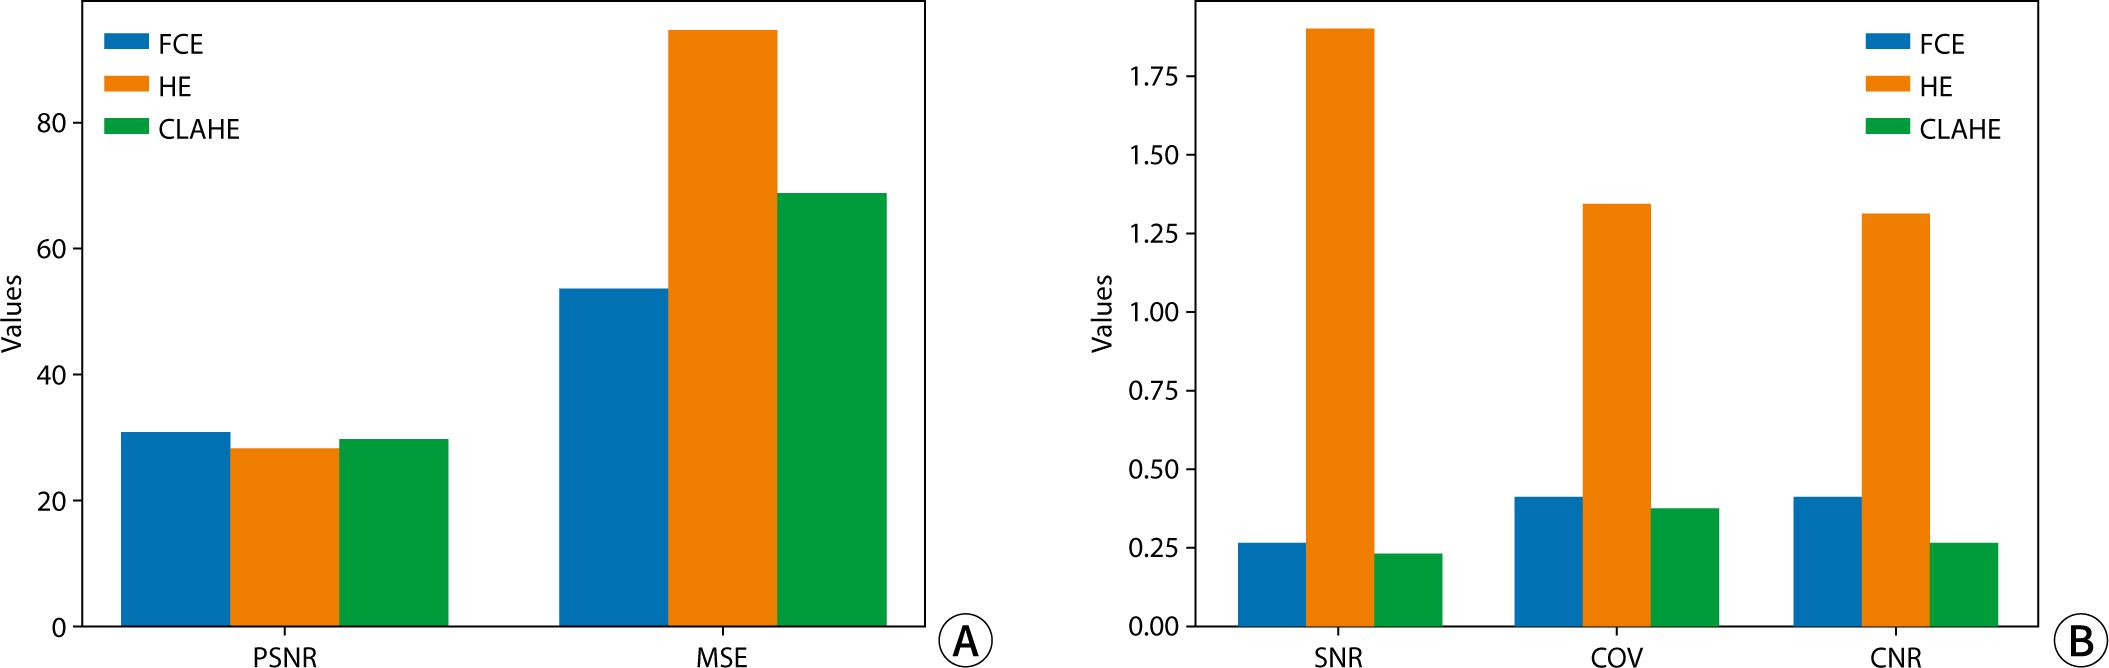
The quantitative assessment of each image utilized PSNR, MSE, SNR, and CNR (
Fig. 4). In terms of PSNR and MSE values,
image quality was ranked from highest to lowest as follows: FCE, CLAHE, and HE.
Regarding factors evaluating noise and signal intensity in the images, SNR and
COV exhibited higher values in the order of HE, FCE, and CLAHE. Specifically,
for HE, SNR and COV were notably higher at 1.83 and 1.31, respectively,
representing more than a sevenfold and threefold difference compared to other
algorithms, respectively. In assessing contrast, CNR values were highest for HE,
followed in descending order by FCE and CLAHE, with HE demonstrating the highest
contrast at 1.29.
Fig. 4.Quantitative analysis results of images obtained using the contrast
conversion algorithm. (A) PSNR and MSE results; (B) SNR, COV, and CNR
results. FCE, fuzzy contrast enhancement; HE, histogram equalization;
CLAHE, contrast limited adaptive histogram equalization; PSNR, peak
signal-to-noise ratio; MSE, mean squared error; SNR, signal-to-noise
ratio; COV, coefficient of variation; CNR, contrast-to-noise
ratio.

Bone age prediction
A total of 100 original and contrast-enhanced images were used as test data for
bone age prediction in each model.
Table
2 presents the MAE, RMSE, and P-value of the bone age prediction
results across various models and contrast conversion algorithms. To facilitate
comparison of bone age prediction performance using each contrast algorithm,
evaluation results for the original images were also included. The accuracy of
bone age prediction has improved, with statistically significant enhancements
observed when using CLAHE in the CNN model, HE in the Inception V3 model, and HE
in the VGG 19 model. In the Xception model, although the application of CLAHE
and FCE algorithms led to better accuracy in bone age prediction, the
improvements were not statistically significant.
Table 2.MAE, RMSE, and t-test results for each model, comparing the actual
bone age to the predicted bone age for both the original images and the
images subjected to the contrast conversion algorithm
|
Model |
Items |
Original |
Image contrast
conversion methods |
|
CLAHE |
FCE |
HE |
|
CNN |
MAE |
26.05 |
25.81 |
32.21 |
31.74 |
|
RMSE |
2.60 |
2.58 |
3.22 |
3.17 |
|
P-value |
|
<0.05 |
0.22 |
<0.05 |
|
ResNet 50 |
MAE |
43.69 |
46.58 |
44.63 |
54.35 |
|
RMSE |
4.37 |
4.66 |
4.46 |
5.43 |
|
P-value |
|
<0.05 |
<0.05 |
<0.05 |
|
VGG 19 |
MAE |
34.26 |
36.09 |
34.86 |
33.08 |
|
RMSE |
3.43 |
3.61 |
3.49 |
3.31 |
|
P-value |
|
<0.05 |
<0.05 |
<0.05 |
|
Inception V3 |
MAE |
34.54 |
36.03 |
34.94 |
33.29 |
|
RMSE |
3.45 |
3.60 |
3.49 |
3.33 |
|
P-value |
|
0.25 |
<0.05 |
<0.05 |
|
Xception |
MAE |
32.24 |
30.13 |
31.64 |
34.13 |
|
RMSE |
3.22 |
3.01 |
3.06 |
3.41 |
|
P-value |
|
0.49 |
0.19 |
0.05 |
Improvements in bone age prediction led to a reduction in MAE from 2.11 to 0.24
and a decrease in RMSE from 0.21 to 0.02.
Discussion
Key results
In this study, we implemented various bone age prediction models using identical
parameters and evaluated the results by modifying the contrast of the test data.
The Xception model demonstrated the most accurate bone age predictions. After
adjusting the contrast, the PSNR and MSE metrics revealed that the FCE algorithm
delivered the highest quality results. Furthermore, the quantitative assessments
of SNR, COV, and CNR indicated that the HE algorithm produced the highest
values. The prediction of bone age with contrast-adjusted images showed improved
performance in 5 out of 15 cases compared to the original images. However, two
of these five cases did not achieve statistical significance.
Interpretation
The primary cause of these outcomes was linked to the use of unprocessed images
in the training dataset. The original images, obtained from various
institutions, showed variations in how much of the left hand was captured, with
some images featuring the left hand in non-horizontal positions. Although
training the model with diverse datasets might enhance its applicability across
different institutions, it could also negatively affect the model's
performance. Future efforts will focus on acquiring preprocessed training data,
which will involve adjusting the image contrast and ensuring that each image is
horizontally aligned at the wrist bone through image registration. Additionally,
in this study, the training and validation sets were separated in only one
instance for individual model training. Future plans include the use of k-fold
learning during model training to facilitate integrated learning and validation
across the entire dataset.
Racial and ethnic disparities, along with variations in nutritional status and
overall health, may affect bone age measurements. This suggests that applying
bone age criteria directly to contemporary children and adolescents may not be
appropriate [
8]. Previous studies have
developed deep learning-based bone age prediction models specifically optimized
for Korean children and adolescents. These models use hand and wrist radiographs
and have been evaluated for their validity compared to conventional methods
[
9].
This study demonstrated that the deep learning-based Korean model achieved
superior bone age prediction accuracy compared to conventional methods, marking
a significant advancement in precise growth assessment and clinical
decision-making. The Korean bone age model reduces prediction biases and
delivers more accurate age predictions across different age groups. Therefore,
it is imperative to develop bone age prediction models that are customized for
various racial groups.
Limitations
This study does not have any limitations that warrant discussion.
Suggestion for further studies
Future research directions include preprocessing training data to ensure
consistency in image quality and registration, implementing k-fold training to
enhance model robustness, and fine-tuning models using datasets specific to
Korean populations. These endeavors aim to enhance the overall accuracy and
applicability of bone age prediction models in clinical practice, ultimately
improving growth assessment and clinical decision-making for pediatric
patients.
Conclusion
This study shows that when model learning is performed using non-preprocessed data,
there is no significant difference in bone age prediction performance between
contrast-converted images and original images. Rather than applying post-processing
to the test dataset to improve predictions, it will be necessary to preprocess the
training dataset.
Authors' contributions
-
Project administration: Ahn SH
Conceptualization: Ahn SH
Methodology & data curation: Choi DH, Lee R
Funding acquisition: Ahn SH, Lee R
Writing – original draft: Choi DH, Ahn SH, Lee R
Writing – review & editing: Choi DH, Ahn SH, Lee R
Conflict of interest
-
So Hyun Ahn has been an assistant editor of the Ewha Medical
Journal since August 2023. However, she was not involved in the
review process. No other potential conflict of interest relevant to this review
was reported.
Funding
-
This research was supported by Basic Science Research Program through the
National Research Foundation of Korea (NRF) funded by the Ministry of Education
(RS-2023-00240003 and RS-2023-00257618).
Data availability
-
Data files are available from Harvard Dataverse: https://doi.org/10.7910/DVN/NMUR8X
Dataset 1. 2017 RSNA AI Pediatric Bone Age Challenge. Available from: https://www.rsna.org/rsnai/ai-image-challenge/RSNA-Pediatric-Bone-Age-Challenge-2017
Dataset 2. The datasets generated during and/or analyzed during the current
study
Acknowledgments
Not applicable.
Supplementary materials
-
Not applicable.
References
- 1. Cavallo F, Mohn A, Chiarelli F, Giannini C. Evaluation of bone age in children: a mini-review. Frontiers Pediatr 2021;9:580314
- 2. Wang S, Wang X, Shen Y, He B, Zhao X, Cheung PWH, et al. An ensemble-based densely-connected deep learning system for
assessment of skeletal maturity. IEEE Trans Syst Man Cybern Syst 2020;52(1):426-437.
- 3. Ferrillo M, Curci C, Roccuzzo A, Migliario M, Invernizzi M, de Sire A. Reliability of cervical vertebral maturation compared to
hand-wrist for skeletal maturation assessment in growing subjects: a
systematic review. J Back Musculoskelet Rehabil 2021;34(6):925-936.
- 4. Satoh M, Hasegawa Y. Factors affecting prepubertal and pubertal bone age
progression. Front Endocrinol 2022;13:967711
- 5. Ahn KS, Bae B, Jang WY, Lee JH, Oh S, Kim BH, et al. Assessment of rapidly advancing bone age during puberty on elbow
radiographs using a deep neural network model. Eur Radiol 2021;31(12):8947-8955.
- 6. Maratova K, Zemkova D, Sedlak P, Pavlikova M, Amaratunga SA, Krasnicanova H, et al. A comprehensive validation study of the latest version of
BoneXpert on a large cohort of Caucasian children and
adolescents. Front Endocrinol 2023;14:1130580
- 7. Son SJ, Song Y, Kim N, Do Y, Kwak N, Lee MS, et al. TW3-based fully automated bone age assessment system using deep
neural networks. IEEE Access 2019;7:33346-33358.
- 8. Gilsanz V, Ratib O. Hand bone age: a digital atlas of skeletal maturity. Berlin: Springer; 2005.
- 9. Kim PH, Yoon HM, Kim JR, Hwang JY, Choi JH, Hwang J, et al. Bone age assessment using artificial intelligence in Korean
pediatric population: a comparison of deep-learning models trained with
healthy chronological and Greulich-Pyle ages as labels. Korean J Radiol 2023;24(11):1151-1163.
Figure & Data
Citations
Citations to this article as recorded by

- Early to Mature, Early to Detect: Artificial Intelligence in the Risk Prediction and Diagnosis of Precocious Puberty
Manisha Chavan, Sameena Tabassum, Divya Dinesh Joshi, Kusalik Boppana, Nasreen Banu, Riya Kayarkar, Kalp Chauhan, Gayathri Yerrapragada, Poonguzhali Elangovan, Mohammed Naveed Shariff, Thangeswaran Natarajan, Jayarajasekaran Janarthanan, Shreshta Agarwal,
Reproductive Medicine.2026; 7(1): 9. CrossRef - X-Ray Images for Automated Bone Age Estimation: Historical, Modern, and Prospective Patterns
M. Priyanka, N. Manohar, R. Suresha, R. Dayananda, Smitha Sunil Kumaran Nair, T. Sheela
IEEE Access.2026; 14: 23367. CrossRef - How Can Clinicians Leverage Vibe Coding for Machine Learning and Deep Learning Research?
Yoonhwan Lee, Sun Huh
Endocrinology and Metabolism.2025; 40(5): 659. CrossRef - Gender equity in medicine, artificial intelligence, and other
articles in this issue
Sun Huh
The Ewha Medical Journal.2024;[Epub] CrossRef