Department of Ophthalmology, Ewha Womans University School of Medicine, Seoul, Korea.
1Department of Ophthalmology, Hanyang University School of Medicine, Seoul, Korea.
Copyright © 2017. Ewha Womans University School of Medicine
This is an Open Access article distributed under the terms of the Creative Commons Attribution Non-Commercial License (http://creativecommons.org/licenses/by-nc/4.0/) which permits unrestricted non-commercial use, distribution, and reproduction in any medium, provided the original work is properly cited.


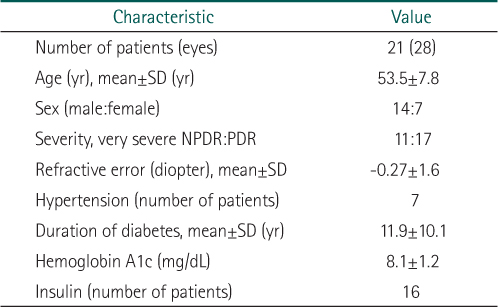
NPDR, nonproliferative diabetic retinopathy; PDR, proliferative diabetic retinopathy.
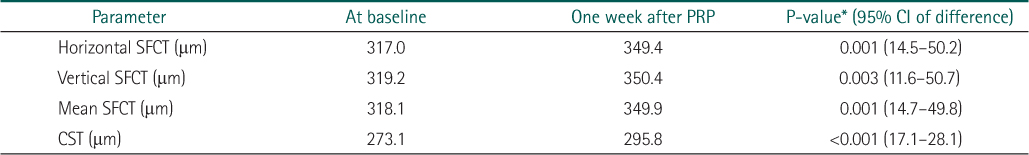
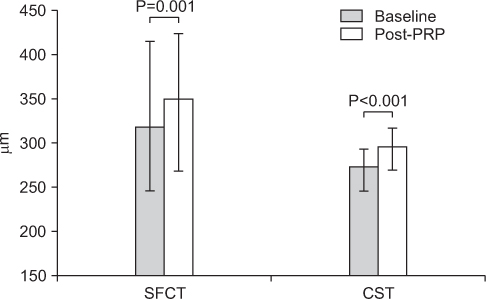
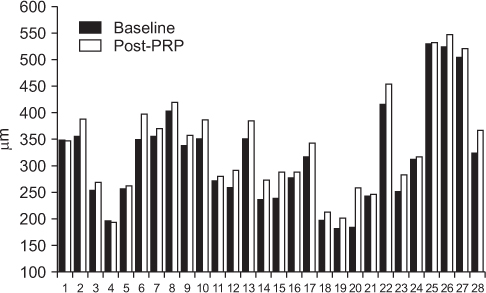
Note that both SFCT and CST increased significantly after PRP.
SFCT, subfoveal choroidal thickness; CST, central subfield thickness; PRP, panretinal photocoagulation; CI, confidence interval.
*Analysis performed by the paired-sample t-test.
NPDR, nonproliferative diabetic retinopathy; PDR, proliferative diabetic retinopathy.
Note that both SFCT and CST increased significantly after PRP. SFCT, subfoveal choroidal thickness; CST, central subfield thickness; PRP, panretinal photocoagulation; CI, confidence interval. *Analysis performed by the paired-sample t-test.