1Department of Dermatology, Ewha Womans University Mokdong Hospital, Ewha Womans University College of Medicine, Seoul, Korea
2Department of Dermatology, Ewha Womans University Seoul Hospital, Ewha Womans University College of Medicine, Seoul, Korea
*Corresponding author: You Won Choi,
Department of Dermatology, Ewha Womans University Seoul Hospital, Ewha Womans
University College of Medicine, 260, Gonghang-daero, Gangseo-gu, Seoul 07804,
Korea, E-mail: uwon313@ewha.ac.kr
• Received: November 25, 2024 • Revised: December 13, 2024 • Accepted: December 16, 2024
This is an Open-Access article distributed under the terms of the
Creative Commons Attribution Non-Commercial License (http://creativecommons.org/licenses/by-nc/4.0) which permits
unrestricted non-commercial use, distribution, and reproduction in any
medium, provided the original work is properly cited.
Objectives: This study aimed to evaluate the correlation between
mast cell (MC) density in rosacea-affected skin and the expression of key
inflammatory mediators, including IL-6, TNF-α, and cathelicidin LL-37. By
comparing lesions rich in MCs with those having fewer MCs, we sought to
elucidate the role of MCs in the inflammatory mechanisms underlying rosacea
pathogenesis.
Methods: Specimens were collected from 20 patients diagnosed with
rosacea who attended the outpatient clinic between 2008 and 2013. Each specimen
underwent staining using hematoxylin/eosin, Giemsa, IL-6, LL-37, and
TNF-α for both histopathological and immunohistochemical analyses. The
number of stained cells was counted across 10 randomly selected dermal layers at
a magnification of ×400 using light microscopy. The results were
categorized based on the number of MCs counted: more than 10 MCs were classified
as MC-rich, and 10 or fewer MCs as MC-poor.
Results: Among the 20 patients (10 MC-rich and 10 MC-poor), the
MC-rich group demonstrated significantly higher MC counts than the MC-poor group
(P<0.001). However, there were no significant differences in the
expression levels of IL-6, LL-37, or TNF-α between the two groups.
Additionally, MC density did not show any significant associations with patient
demographics, clinical characteristics, or systemic comorbidities.
Conclusion: Increased MC density was not associated with differences
in IL-6, TNF-α, or LL-37 expression in rosacea lesions. These findings
suggest that MC infiltration may not directly influence the inflammatory
mediator profile in rosacea. Further research is required to identify
distinctive pathological features or markers that can elucidate the mechanisms
of rosacea.
Rosacea is a chronic inflammatory disorder primarily affecting the central facial
region, characterized by periods of exacerbation and remission. It manifests as
four clinically recognized subtypes: erythematotelangiectatic, papulopustular,
phymatous, and ocular rosacea, each with distinct clinical features [1]. Although the precise etiology of rosacea
remains unclear, its pathogenesis is thought to involve an interplay of
environmental triggers, vascular dysfunction, alterations in dermal matrix
composition, and genetic predisposition.
Emerging studies have focused on the role of inflammatory responses in chronic
skin conditions, with mast cells (MCs) receiving particular attention due to
their involvement in various inflammatory skin diseases. MCs are known for their
contribution to localized vasodilation and angiogenesis and are considered a key
player in inflammatory cascades [2]. In
rosacea, MCs are postulated to interact with stimuli such as cathelicidin
peptides and neuropeptides (NPs), potentially contributing to hallmark symptoms
such as erythema and flushing [2,3]. MCs release a range of inflammatory
mediators, including TNF, IL-6, and other pro-inflammatory cytokines, which may
exacerbate the inflammatory state in rosacea [3]. Although previous studies have identified increased MC counts in
rosacea-affected skin, the exact contribution of MCs to the condition’s
pathogenesis, particularly their influence on inflammatory mediator expression,
warrants further exploration [4].
Objectives
This study aimed to assess the relationship between MC presence and the
expression of specific inflammatory mediators in rosacea-affected skin. By
analyzing these interactions, we sought to clarify further the potential role of
MCs in the inflammatory processes underlying rosacea.
Methods
Ethics statement
This study received approval from the Institutional Review Board (IRB) of Ewha
Womans University Mokdong Hospital (IRB No. EUMC 2024-11-001). A waiver of
informed consent was granted, owing to the utilization of pre-existing databases
and skin biopsy results.
Study design
This was a comparative study using biopsy samples from rosacea patients.
Setting
Rosacea patients who visited the outpatient clinic of the Department of
Dermatology, Ewha Womans University Mokdong Hospital, and Ewha Womans University
Seoul Hospital between 2008 and 2014 were included in this study. A 4-mm punch
biopsy was taken from a facial lesion of these patients. The skin biopsy samples
were used for MC quantification and immunohistochemical analysis of inflammatory
mediators. Clinical data such as age, gender, duration of disease (in months),
specific sites of facial involvement, clinical manifestations, and comorbidities
were extracted from electronic medical records. Systemic comorbidities were
confirmed through medical records and documentation of current medications.
Participants
This study included twenty patients, each diagnosed with rosacea by
dermatologists. However, the analysis did not categorize or differentiate
between specific rosacea subtypes, and no patients were excluded.
Variables
The outcome variables included MC counts, clinical data, and the expression of
inflammatory mediators such as IL-6, TNF-α, and LL-37.
Data sources/measurement
Mast cell quantification
Tissue specimens were fixed in 10% buffered formalin, embedded in paraffin,
and sectioned at a thickness of 4 μm. The sections were stained with
hematoxylin and eosin for routine histological examination and with Giemsa
stain for MC visualization. Two independent observers, who were blinded to
the clinical data, counted the MCs using an Olympus light microscope at
400× magnification. In each specimen, MCs were counted in 10 HPFs
that were randomly selected and distributed across different dermal layers:
four fields in the papillary dermis, three in the mid-reticular dermis, and
three in the bottom reticular dermis. Only cells displaying both a distinct
nucleus and metachromatic granules were included in the count. The final MC
count was determined by averaging the counts from both observers.
The compartments were divided into 22 sections to ensure a systematic and
reproducible method for MC counting. This approach facilitated a
comprehensive assessment of MC distribution throughout the tissue,
minimizing bias due to regional variations in cell density. By dividing the
area into smaller sections, the counting process was standardized, leading
to more accurate and consistent results across various samples.
Specimens were categorized based on MC density, using well-defined criteria
for different density groups. A threshold of 10 MCs per HPF was established
from the MC counts, indicating that 10 MCs per HPF is an appropriate cutoff
to differentiate areas of high MC density from those with low density. This
threshold allowed us to classify the samples into MC-rich and MC-poor
groups, reflecting a significant variation in MC abundance. Images were
captured with a Jenoptik ProgRes GRYPHAX Subra Microscope HD Camera.
Immunohistochemical analysis for inflammatory mediators
Immunohistochemical staining was conducted following standard protocols. The
process began with deparaffinization of the sections, followed by antigen
retrieval using citrate buffer at a pH of 6.0. This was succeeded by
blocking endogenous peroxidase activity with 3% hydrogen peroxide. Primary
antibodies targeting IL-6, TNF-α, and LL-37, all at a dilution of
1:100, were then applied. The intensity of the staining was assessed by two
observers who were blinded to the sample identities. They used a
semi-quantitative scoring system with the following scale: 0 (negative), 1
(weak), 2 (moderate), and 3 (strong). To ensure consistency, the scoring
methodology was standardized across both observers, and an average score was
calculated for each section. Both positive and negative controls were
included to confirm the specificity of the staining.
Bias
There was no selection bias among the target subjects, as all cases were included
that had histological confirmation.
Study size
No sample size estimation was done since all target subjects were included.
Statistical methods
Data analysis was conducted using IBM SPSS Statistics v.22.0 (IBM, Armonk, NY,
USA). Continuous variables, such as MC counts, are presented as mean±SD,
while categorical variables, including immune mediators, are reported as
frequencies and percentages. Comparisons between groups were performed using the
independent samples t-test. Correlations between MC counts and
immunohistochemical markers were evaluated using Spearman's correlation
coefficient. Statistical significance was established at P<0.05.
Results
Participants
This study encompassed 20 rosacea patients aged between 23 and 75 years, with an
average age of 53.1±13.2 years. The cohort was evenly divided between
sexes, comprising 10 men and 10 women. The duration of disease among
participants varied widely, ranging from 1 month to 15 years, with a median
duration of 32.6 months. The most frequently affected areas were the forehead
(45%), nose (35%), and cheeks (20%). Additional details on patient
characteristics are provided in Table
1.
Table 1.
Clinicopathological and immunohistochemical results of two
groups
Clinicopathological and immunohistochemical results
Based on MC counts, patients were divided into two groups: the MC-rich group,
which included individuals with 10 or more MCs per HPF (n=10), and the MC-poor
group, which included individuals with fewer than 10 MCs per HPF (n=10).
Representative high-magnification images of MC distribution for each group are
displayed in Figs. 1, 2. There was a significant difference in the mean MC count
between the groups, with the MC-poor group averaging 3.15±0.87 MCs per
HPF and the MC-rich group averaging 10.8±2.58 MCs per HPF
(P<0.001; Table 1).
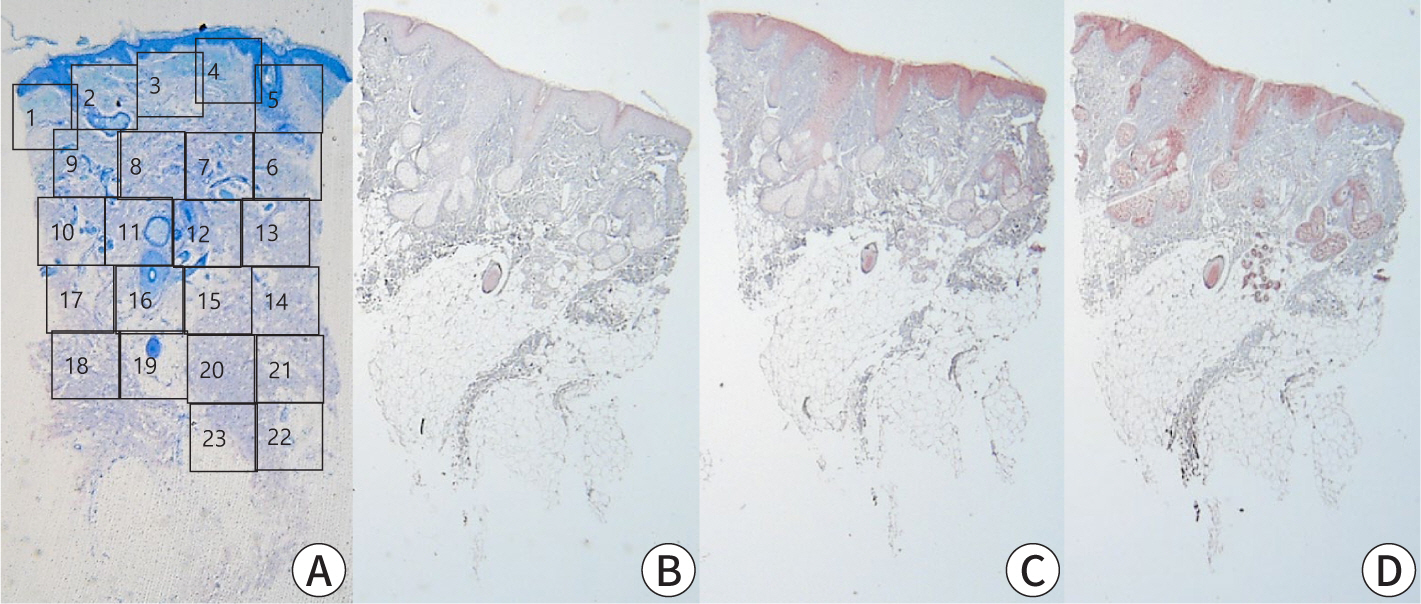
Fig. 1.
Histopathological and immunohistochemical analysis in mast cell-rich
group. (A) Histopathology of the lesional skin in MC-rich group patient.
Numbers show the counting methods in MC numbers (Giemsa, ×40).
(B–D) Immunohistochemical analysis (×40). (B) IL-6
staining, (C) LL-37 staining, (D) TNF-α staining.
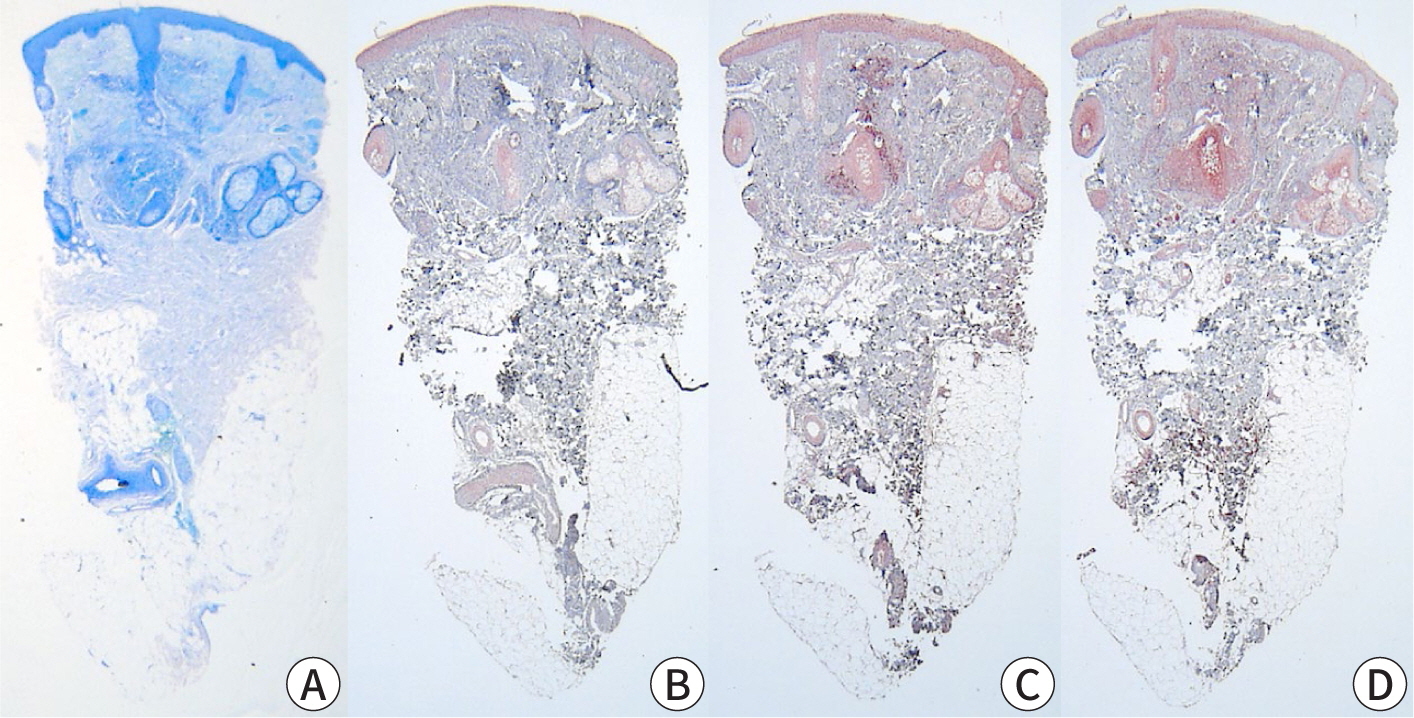
Fig. 2.
Histopathological and immunohistochemical analysis in mast cell-poor
group. (A) Histopathology of the lesional skin in the MC-poor group
patient (Giemsa, ×40). (B–D) Immunohistochemical analysis
(×40). (B) IL-6 staining, (C) LL-37 staining, (D) TNF-α
staining.
In terms of clinical characteristics, there were no significant demographic
differences between the MC-poor and MC-rich groups. Both groups had similar ages
(52.8±14.18 years vs. 53.3±12.89 years, P=0.935) and an equal
distribution of genders. Additionally, there were no significant differences in
the severity of clinical features, including affected sites and the incidence of
pruritus, although pruritus was more commonly reported in the MC-poor group,
though not to a statistically significant extent. Regarding systemic
comorbidities, prevalent conditions included diabetes mellitus, hypertension,
dyslipidemia, liver disease, gastritis, and peptic ulcer. While these
comorbidities appeared more frequently in the MC-rich group, the difference was
not statistically significant. Furthermore, no meaningful correlation was found
between MC counts and systemic comorbidities (Table 1).
Distribution patterns of inflammatory mediators within various skin
compartments
Immunohistochemical analysis was performed to evaluate the expression of
inflammatory markers in the epidermal and dermal layers, as well as in the skin
appendages. The semi-quantitative analysis revealed no statistically significant
differences in marker expression between the two groups. Specifically, IL-6
levels were 1.32±0.71 in the MC-rich group and 1.56±0.91 in the
MC-poor group (P=0.519); LL-37 levels were 0.8±0.55 in the MC-rich group
and 1.0±0.59 in the MC-poor group (P=0.443); TNF-α levels were
0.84±0.65 in the MC-rich group and 1.04±0.32 in the MC-poor group
(P=0.400). Table 2 provides additional
details on the distribution patterns of these markers across different skin
compartments.
Table 2.
Comparison between mast cell-rich group (mast cell-rich group) and
mast cell-poor group (mast cell-poor group) in the number of mast cells,
IL-6, LL-37, TNF-α (number/HPF [×400])
Slide number
Mast cells
IL-6
LL37
TNF-α
Mast cell-rich group
1
12.93
1
0.4
0.2
2
8.45
0.8
0.8
0.6
3
12.53
1
0.4
0.6
4
16.2
1.8
0.2
0.2
5
10.4
0.4
0.4
0.8
6
11.55
0.8
0.6
0.4
7
8
0.8
0.6
0.4
8
9.13
2.2
1.2
2
9
10.5
2.4
1.6
1.6
10
8.3
2
1.8
1.6
Mast cell-poor group
1
3.1
1.2
0.4
0.6
2
1.1
0.4
0.6
1.4
3
4.35
0.6
1.2
1
4
2.9
2.4
0.8
1
5
4.05
1.2
2.4
1.6
6
2.95
0.6
0.8
0.8
7
3.45
1.4
1.4
0.8
8
3.15
2.8
0.4
0.8
9
3
2.6
1
1
10
3.45
2.4
1
1.4
LL-37, cathelicidin LL-37.
Discussion
Key results
This study aimed to elucidate the role of MCs in the pathophysiology of rosacea
and to investigate the relationship between MC density and mediator release in
affected skin. We observed distinct differences in MC counts among patients,
allowing us to categorize them into MC-poor and MC-rich groups. Although there
were increased MC counts, these did not correlate with significant differences
in clinical characteristics or biological markers, such as IL-6, LL-37, and
TNF-α. These findings underscore the complexity of the cytokine network
in rosacea and suggest that MC infiltration alone may not be sufficient to fully
drive clinical manifestations.
Interpretation/comparison with previous studies
The pathogenesis of rosacea is not fully understood; however, MCs are known to
enhance various inflammatory processes and are linked to angiogenesis, which is
relevant to the pathophysiology of rosacea [1]. Cathelicidin, highly expressed in rosacea, releases its cleavage
product LL-37. This, in conjunction with heightened serine protease activity,
triggers inflammatory cascades, including the activation of MCs [5,6].
Additionally, dysregulated immune responses and neurovascular dysfunctions are
implicated as contributing factors in rosacea [7].
MCs can be activated through various pathways. Beyond the IgE-mediated
degranulation pathway [2], activation can
also occur via pathogen- and pattern-recognition receptors, including Toll-like
receptors. TNF-α is known to trigger the activation of the NLRP3
inflammasome pathway and also activates NF-κB in MCs [8]. Additionally, other receptors such as
MRGPRX2, complement receptors, and NP and neurotransmitter receptors can
influence MC activation in response to LL-37 and NPs [9,10]. The diversity
of these pathways highlights the complexity of MC activation mechanisms, which
may explain why MC density alone did not correlate with specific clinical or
inflammatory features in our cohort [11,12].
Furthermore, rosacea is associated with a variety of comorbidities, including
allergies, respiratory and gastrointestinal disorders, metabolic and
cardiovascular diseases, and certain malignancies [4,13]. It has been
suggested that shared genetic and environmental factors, along with immune
regulatory processes, may underlie these associations [13]. In our study, patients exhibited systemic
comorbidities such as diabetes mellitus, hypertension, and dyslipidemia.
However, no significant association was found between MC counts and the
prevalence of systemic comorbidities, likely due to the small sample size.
Limitations
The limitations of this study include a small sample size and variability in
disease duration and previous treatments among patients, which could influence
MC density, cytokine expression, and clinical characteristics. Additionally, the
absence of standardized laboratory data on systemic comorbidities limits our
ability to interpret potential correlations between these comorbidities and MC
count or activity. Moreover, variations in histopathological characteristics and
types of rosacea lesions were not thoroughly analyzed, potentially affecting the
intensities of MC and cytokine expression. Methodological constraints, such as
possible recall and response biases, along with a lack of control for detection
and measurement biases in MC counting, may also have impacted the results.
Suggestion for further studies
Future studies should consider using larger, well-characterized samples from
multiple centers, along with standardized protocols for quantifying MC activity
and inflammatory markers in different rosacea subtypes and lesion
characteristics.
Conclusion
MCs play a significant role in the pathogenesis of rosacea through mechanisms
involving innate immune responses, neurogenic inflammation, angiogenesis, and
fibrosis [1]. However, this study found no
significant association between MC count, cytokine levels, and the clinical
features of rosacea. Our findings suggest that MC activity may be a more
valuable indicator than MC count alone for evaluating the biological behavior of
rosacea. Additionally, relying solely on IL-6, LL-37, and TNF-α staining
may not adequately capture MC activity. It is possible that MCs impact the
surrounding skin tissue indirectly, without directly influencing the specific
biological markers evaluated in this study.
The pathology of rosacea likely involves multiple factors, indicating complex
interrelationships among its contributing elements. This study failed to
establish a clear correlation between the clinical characteristics of rosacea
and either MC count or cytokine levels. Therefore, further research is crucial
to identify distinct pathological markers that could elucidate the mechanisms
underlying rosacea. Future studies should also concentrate on examining the
complex relationship between MCs and the multifaceted nature of this condition
to improve our understanding and management approaches.
Authors' contributions
Project administration: Choi YW
Conceptualization: Choi YW
Methodology & data curation: Lee JJ, Kwon BR, Lee MY, Byun JY, Roh JY,
Choi HY
Funding acquisition: not applicable
Writing – original draft: Lee JJ
Writing – review & editing: Lee JJ, Kwon BR, Lee MY, Byun JY, Roh
JY, Choi HY, Choi YW
Conflict of interest
Ji Yeon Byun has been the associate editor of the Ewha Medical Journal since
2018. However, she was not involved in the peer review process or
decision-making. Otherwise, no potential conflict of interest relevant to this
article was reported.
Funding
Not applicable.
Data availability
Not applicable.
Acknowledgments
Not applicable.
Supplementary materials
Not applicable.
References
1. Aroni K, Tsagroni E, Kavantzas N, Patsouris E, Ioannidis E. A study of the pathogenesis of rosacea: how angiogenesis and mast
cells may participate in a complex multifactorial process. Arch Dermatol Res 2008;300:125-131.
2. Muto Y, Wang Z, Vanderberghe M, Two A, Gallo RL, Di Nardo A. Mast cells are key mediators of cathelicidin-initiated skin
inflammation in rosacea. J Invest Dermatol 2014;134(11):2728-2736.
3. Aksoy B, Ekiz Ö, Unal E, Ozaydin Yavuz G, Gonul M, Kulcu Cakmak S, et al. Systemic comorbidities associated with rosacea: a multicentric
retrospective observational study. Int J Dermatol 2019;58(6):722-728.
5. Yamasaki K, Di Nardo A, Bardan A, Murakami M, Ohtake T, Coda A, et al. Increased serine protease activity and cathelicidin promotes skin
inflammation in rosacea. Nat Med 2007;13:975-980.
6. Marchitto MC, Chien AL. Mast cell stabilizers in the treatment of rosacea: a review of
existing and emerging therapies. Dermatol Ther 2021;11:1541-1549.
8. Nakamura Y, Franchi L, Kambe N, Meng G, Strober W, Nunez G. Critical role for mast cells in interleukin-1β-driven skin
inflammation associated with an activating mutation in the Nlrp3
protein. Immunity 2012;37(1):85-95.
9. Subramanian H, Gupta K, Ali H. Roles of Mas-related G protein-coupled receptor X2 on mast
cell-mediated host defense, pseudoallergic drug reactions, and chronic
inflammatory diseases. J Allergy Clin Immunol 2016;138(3):700-710.
No difference in inflammatory mediator expression between mast
cell-rich and mast cell-poor rosacea lesions in Korean patients: a comparative
study
Fig. 1.
Histopathological and immunohistochemical analysis in mast cell-rich
group. (A) Histopathology of the lesional skin in MC-rich group patient.
Numbers show the counting methods in MC numbers (Giemsa, ×40).
(B–D) Immunohistochemical analysis (×40). (B) IL-6
staining, (C) LL-37 staining, (D) TNF-α staining.
Fig. 2.
Histopathological and immunohistochemical analysis in mast cell-poor
group. (A) Histopathology of the lesional skin in the MC-poor group
patient (Giemsa, ×40). (B–D) Immunohistochemical analysis
(×40). (B) IL-6 staining, (C) LL-37 staining, (D) TNF-α
staining.
Fig. 1.
Fig. 2.
No difference in inflammatory mediator expression between mast
cell-rich and mast cell-poor rosacea lesions in Korean patients: a comparative
study
Clinicopathological and immunohistochemical results of two
groups
Mast cell (MC)-rich group
MC-poor group
P-value
Demographics
Sex (female)
6 (60)
4 (40)
0.328
Age1)
52.8±14.18
53.3±12.89
0.935
Past history
7 (63.64)
4 (36.36)
0.370
Diabetes mellitus
3 (75)
1 (25)
0.582
Hypertension
4 (57.14)
3 (42.86)
1.000
Dyslipidemia
1 (50)
1 (50)
1.000
Liver disease
1 (50)
1 (50)
1.000
Gastritis, peptic ulcer
2 (66.67)
1 (33.33)
1.000
Site
Forehead, glabella
7 (46.67)
8 (53.33)
1.000
Periorbital
1 (33.33)
2 (66.67)
1.000
Cheeks
6 (46.15)
7 (53.85)
1.000
Nose, perinasal
6 (42.86)
8 (57.14)
0.628
Chin
4 (33.33)
8 (66.67)
0.170
Perioral, lip
3 (100)
0 (0)
0.211
Signs and symptoms
Erythematous papules
5 (38.46)
8 (61.54)
0.350
Erythematous patches
6 (46.15)
7 (53.85)
1.000
Telangiectasia
3 (75)
1 (25)
0.582
Itching
2 (25)
6 (75)
0.170
Immunohistochemical
parameters1)
Mast cells
10.8±2.58*
3.15±0.87*
<0.001*
IL-6
1.32±0.71
1.56±0.91
0.519
LL37
0.8±0.55
1±0.59
0.443
TNF-α
0.84±0.65
1.04±0.32
0.400
LL-37, cathelicidin LL-37; MC-rich group: the number of counted MCs
was 10 or more; MC-poor group: the number of counted MCs was fewer
than 10.
1)Data are presented as mean±SD, while other data are expressed
as number (%).
Comparison between mast cell-rich group (mast cell-rich group) and
mast cell-poor group (mast cell-poor group) in the number of mast cells,
IL-6, LL-37, TNF-α (number/HPF [×400])
Slide number
Mast cells
IL-6
LL37
TNF-α
Mast cell-rich group
1
12.93
1
0.4
0.2
2
8.45
0.8
0.8
0.6
3
12.53
1
0.4
0.6
4
16.2
1.8
0.2
0.2
5
10.4
0.4
0.4
0.8
6
11.55
0.8
0.6
0.4
7
8
0.8
0.6
0.4
8
9.13
2.2
1.2
2
9
10.5
2.4
1.6
1.6
10
8.3
2
1.8
1.6
Mast cell-poor group
1
3.1
1.2
0.4
0.6
2
1.1
0.4
0.6
1.4
3
4.35
0.6
1.2
1
4
2.9
2.4
0.8
1
5
4.05
1.2
2.4
1.6
6
2.95
0.6
0.8
0.8
7
3.45
1.4
1.4
0.8
8
3.15
2.8
0.4
0.8
9
3
2.6
1
1
10
3.45
2.4
1
1.4
LL-37, cathelicidin LL-37.
Table 1.
Clinicopathological and immunohistochemical results of two
groups
LL-37, cathelicidin LL-37; MC-rich group: the number of counted MCs
was 10 or more; MC-poor group: the number of counted MCs was fewer
than 10.
Data are presented as mean±SD, while other data are expressed
as number (%).
Table 2.
Comparison between mast cell-rich group (mast cell-rich group) and
mast cell-poor group (mast cell-poor group) in the number of mast cells,
IL-6, LL-37, TNF-α (number/HPF [×400])

 , Bo Ram Kwon1