1Department of Internal Medicine, Seoul National University Bundang Hospital, Seongnam, Korea
2Division of Clinical Research, Research Institute, National Cancer Center, Goyang, Korea
3Department of Internal Medicine and Liver Research Institute, Seoul National University College of Medicine, Seoul, Korea
*Corresponding author: Nayoung Kim,
Department of Internal Medicine, Seoul National University Bundang Hospital, 82
Gumi-ro 173beon-gil, Bundang-gu, Seongnam 13620, Korea, E-mail:
nakim49@snu.ac.kr
*These authors contributed equally to this work.
• Received: March 14, 2024 • Accepted: April 18, 2024
This is an Open-Access article distributed under the terms of the
Creative Commons Attribution Non-Commercial License (http://creativecommons.org/licenses/by-nc/4.0) which permits
unrestricted non-commercial use, distribution, and reproduction in any
medium, provided the original work is properly cited.
Objectives: Gastric cancer (GC) demonstrates a sex disparity that
may also be associated with body mass index (BMI). This study explored whether
the effect of BMI on the risk of GC varies by sex.
Methods: The study cohort included 341,999 Koreans aged 40 years or
older from the National Health Insurance Service–Health Screening Cohort,
with a median follow-up period of 10 years. Participants were categorized into
five groups based on their BMI. The effect of BMI was evaluated using Cox
proportional hazard regression. Additionally, stratification analysis was
performed according to waist circumference.
Results: An increased risk of developing GC was observed across the
study population among those with obesity (BMI 25.0–29.9
kg/m2; hazard ratio [HR], 1.11; 95% CI , 1.03–1.20) and severe
obesity (BMI ≥30.0 kg/m2; HR, 1.22; 95% CI, 1.01–1.47),
considering a 2-year latency period. Notably, the rise in GC risk was
particularly pronounced among women with obesity and men with severe obesity. In
the age-stratified analysis, severe obesity (BMI ≥30.0 kg/m2)
was associated with an increased risk of GC in men under 50 years old (HR, 1.83;
95% CI, 0.99–3.37). For individuals aged ≥50 years, obesity was
linked to a heightened risk of GC in both sexes. Furthermore, normal BMI
(18.5–22.9 kg/m2) was associated with an increased GC risk in
women.
Conclusion: These findings indicate a positive association between
excess body weight and the risk of GC in Koreans, particularly among men with
severe obesity.
Gastric cancer (GC) represents the fifth most common malignancy worldwide and
exhibits the highest incidence rates in Eastern Asia, including South Korea
[1,2]. Traditional risk factors for GC encompass Helicobacter
pylori infection, dietary patterns, and exposure to risk factors
such as alcohol consumption and smoking [3–5]. Furthermore, the
influence of obesity on the development of non-communicable diseases, including
GC, has become more pronounced [6],
paralleling the global rise in obesity rates [7].
Despite considerable interest and research, the relationship between obesity and
GC remains less clear than for other cancers, such as colon cancer [8,9].
This ambiguity is partly because the pathogenesis of GC varies by anatomical
location. Cardia and non-cardia GCs each have unique pathological and
etiological features [10]. In cardia
cancers, the risk of developing GC due to obesity is higher, and the association
with obesity is more pronounced. In contrast, non-cardia cancers do not exhibit
a significant link with obesity [11].
However, a recent study from Korea suggested that underweight was associated
with an increased risk of developing GC [12], with a U-shaped pattern of risk increase. Therefore, the
relationship between underweight or overweight and the risk of developing GC
necessitates further investigation. GC is also recognized as a male-dominant
disease [13], with this sex difference
typically attributed to variations in exposure to risk factors and the influence
of sex hormones [14,15]. The effect of weight outside the normal range on the
development of GC likely differs between sexes, given that estrogen, a key sex
hormone, is associated with obesity [15].
Objectives
Consequently, our goal was to analyze the impact of body mass index (BMI) on the
risk of developing GC by sex, drawing on data from a large-scale retrospective
cohort study and a review of the existing literature.
Methods
Ethics statement
The study protocol was approved by the institutional review board (IRB) of Seoul
National University Bundang Hospital (IRB No. X-2209-780-901). The requirement
for informed consent was waived by the IRB.
Study design
This retrospective cohort study was conducted in accordance with the
Strengthening the Reporting of Observational Studies in Epidemiology statement
(https://www.strobe-statement.org/).
Setting
In February and March of 2024, the authors conducted a search regarding BMI and
GC within the National Health Insurance Service–Health Screening Cohort
(NHIS-HEALS) database, which contains records from 2002 to 2019. The selected
data were subsequently analyzed by the authors.
Data sources
Korea operates the National Health Insurance Service (NHIS), a single, mandatory
health insurance system that covers approximately 97% of the Korean population.
The NHIS administers a biennial health checkup program for adults aged 20 years
and older, known as the National Health Screening (NHS). The NHS program
encompasses over 70% of the total population in Korea [16]. During these NHS health checkups, various data are
collected from the examinees. These include anthropometric measurements such as
height, weight, and waist circumference (WC), as well as sociodemographic
factors and health behaviors, including alcohol consumption and smoking status.
Additionally, family and medical histories are recorded alongside laboratory
test results [16,17].
For research purposes, the NHIS constructed a sampled retrospective cohort
consisting of 514,866 participants. These individuals were randomly selected
from participants in the NHS programs in 2002–2003, a cohort referred to
as NHIS-HEALS. This cohort has undergone annual follow-up through 2019 to gather
information on healthcare utilization and mortality.
Participants
Inclusion and exclusion criteria
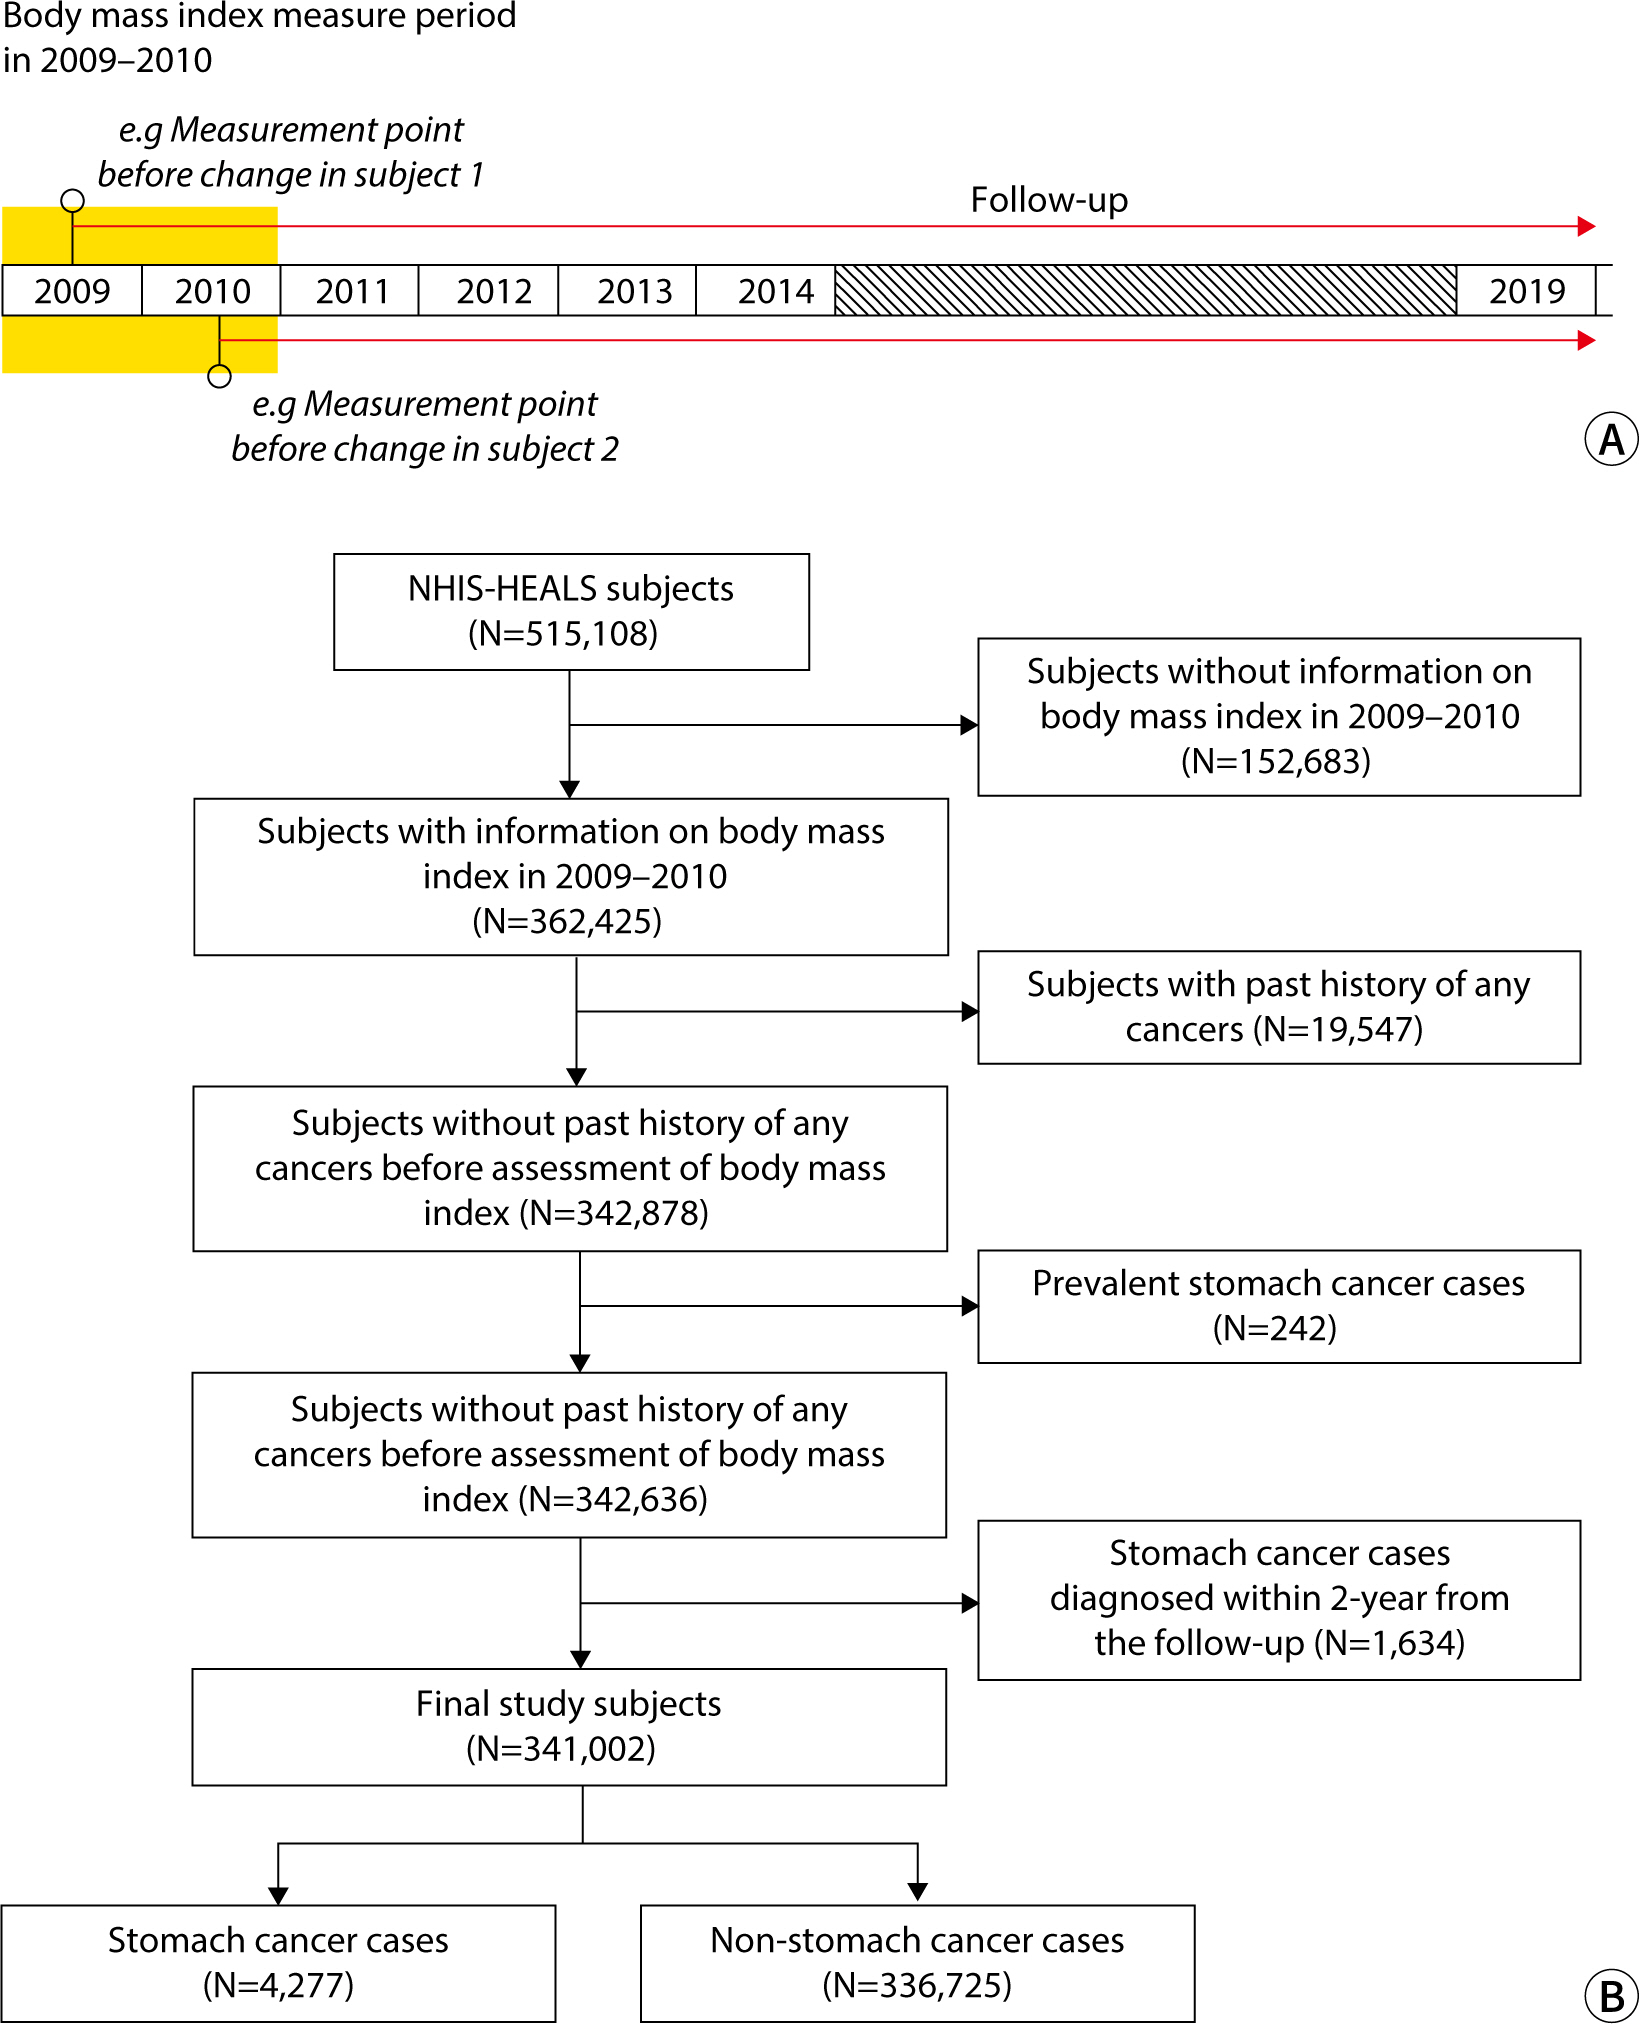
Since the NHS has collected WC data since 2009, we defined 2009–2010
as the baseline period. Among the participants in the NHIS-HEALS
(n=514,866), those lacking information on BMI for 2009–2010 were
excluded. Additionally, we excluded participants with a history of cancer,
operationally defined as those with claims data containing a major diagnosis
code beginning with “C” from 2002–2008. In Korea, the
NHIS offers a program that enables adults over 40 years of age to undergo GC
screening every 2 years. We posited that a minimum of 2 years is necessary
for BMI at a given time point to influence the development of GC.
Consequently, GC cases diagnosed within 2 years following BMI measurement
were excluded. Ultimately, 341,999 participants, including 4,277 GC cases,
were selected for the study (Fig.
1).
Fig. 1.
Study scheme. (A) Time points for measuring body mass index (BMI)
and initiating follow-up. The orange box represents the period
during which BMI was measured in 2009–2010, with follow-up
extending until 2019. (B) Flowchart depicting the selection of study
participants. NHIS-HEALS, National Health Insurance Service-Health
Screening Cohort.
Measurements
Study participants were categorized into four groups based on their BMI,
following the classifications used in a prior study [18]: underweight (BMI <18.5 kg/m2),
normal weight (BMI 18.5–22.9 kg/m2), overweight (BMI
23.0–24.9 kg/m2), obesity (BMI 25.0–29.9
kg/m2), and severe obesity (BMI ≥30.0 kg/m2).
Additionally, WC reference values of 90 cm for male and 85 cm for female
participants were adopted in line with the Korean diagnostic criteria for
metabolic syndrome [18].
We operationally defined GC cases as participants who had medical claims with the
corresponding diagnosis code for GC, specifically the International
Classification of Diseases-10 code C16, along with a history of hospital
admission. The follow-up period was defined as the time from the index date (the
date of BMI measurement) to the date of GC diagnosis, death, or the end of the
follow-up period (December 31, 2019), whichever occurred first.
Variables
The outcome variables included demographic findings, such as a diagnosis of GC,
along with age, WC, and BMI.
Bias
Since participants were selected from the cohort database according to the
inclusion criteria, selection bias was not a concern.
Study size
A sample size estimation was not performed, as all target participants were
included.
Statistical methods
To compare differences in baseline characteristics across BMI levels, we
conducted univariable tests, utilizing the chi-square test for categorical
variables and analysis of variance for continuous variables. The characteristics
considered included sociodemographic factors (such as age, sex, and income),
health behaviors (including smoking status and physical activity), fasting
glucose level, total cholesterol, blood pressure at the time of BMI measurement,
and comorbidities such as diabetes mellitus, hypertension, and dyslipidemia
recorded before the most recent BMI measurement. We assessed GC risk in relation
to BMI by using the overweight group (BMI of 23.0–24.9 kg/m2)
as the reference category in Cox proportional hazard regression analysis.
To account for the influence of baseline characteristics on the development of
GC, we constructed a Cox proportional hazards regression model. This model
included age, sex, alcohol consumption, smoking status, and history of diabetes
mellitus, hypertension, and dyslipidemia as exploratory variables.
Although some baseline characteristics (namely, smoking status and alcohol
consumption) had missing values, the proportions of missing data were relatively
low: 1.9% for smoking status and 3.1% for alcohol consumption. To address the
issue of missing values, we conducted data imputation using the PROC MI
procedure within SAS (SAS Institute, Cary, NC, USA).
All data management and statistical analyses were performed using SAS version
9.4. The protocol of this study was approved by the IRB of Seoul National
University Bundang Hospital (IRB No. X-2209-780-901).
Results
Baseline characteristics of participants
The baseline characteristics of the participants are summarized in Table 1. Most participants fell into the
normal weight, overweight, and obesity categories, with only a small percentage
classified as underweight (2.1%) or having severe obesity (2.8%). Among BMI
categories, the severe obesity group contained the highest proportions of women,
non-smokers, and non-drinkers. Furthermore, the prevalence rates of diabetes,
hypertension, and dyslipidemia increased with rising BMI levels.
Table 1.
Baseline characteristics of study participants according to body mass
index
Risk of gastric cancer according to body mass index
Although we hypothesized that both underweight and obesity were associated with
an increased risk of GC development, only those with obesity (BMI ≥25.0
kg/m2) exhibited an elevated GC risk compared to participants
with a BMI of 23.0–24.9 kg/m2 (BMI 25.0–29.9
kg/m2: hazard ratio [HR], 1.11; 95% CI, 1.03–1.20; BMI
≥30.0 kg/m2: HR, 1.22; 95% CI, 1.01–1.47). However, an
elevated GC risk was not observed in the underweight population in this study.
Although the highest increase in GC risk was found in those with severe obesity,
this association was only noted in the male population (HR, 1.36; 95% CI,
1.12–1.74).
In a sensitivity analysis considering various latency periods, we assessed the
association between BMI and GC risk by repeatedly excluding GC cases diagnosed
within 2, 3, and 4 years of follow-up (Table
2). The analysis showed that the increase in GC risk was consistently
higher with greater severity of obesity, regardless of the latency period
considered. Furthermore, a significantly elevated GC risk in the severe obesity
group was observed exclusively in the male population. Consequently, we applied
a 2-year latency period to subsequent analyses.
Table 2.
Association between body mass index and gastric cancer risk according
to sex
*Adjusted for age, sex, smoking status, alcohol consumption frequency
per week, history of diabetes mellitus, hypertension, and
dyslipidemia with consideration of a 2-year latency period.
†Adjusted for age, smoking status, alcohol consumption frequency per
week, history of diabetes mellitus, hypertension, and dyslipidemia
with consideration of a 2-year latency period.
‡Indicates statistical significance.
Age-stratified risk of gastric cancer according to body mass index
A stratification analysis by age was conducted using a threshold of 50 years
(Table 3). Notably, the NHIS-HEALS
dataset was characterized by a disparity in participant person-years, with
approximately 49,000 for individuals under 50 years and over 3 million for those
aged 50 and above. This resulted in limitations regarding the statistical power
for the subset of participants younger than 50 years.
Table 3.
Association between body mass index and gastric cancer risk in an
age-stratified population
BMI, body mass index; HR, hazard ratio; N/A, not applicable.
*Adjusted for age, sex, smoking status, alcohol consumption frequency
per week, history of diabetes mellitus, hypertension, and
dyslipidemia with consideration of a 2-year latency period.
†Adjusted for age, smoking status, alcohol consumption frequency per
week, history of diabetes mellitus, hypertension, and dyslipidemia
with consideration of a 2-year latency period.
‡Indicates statistical significance.
In individuals under 50 years old, severe obesity (BMI ≥30.0
kg/m2) was associated with a heightened risk of GC in men (HR,
1.83; 95% CI, 0.99–3.37). However, no significant associations between
BMI and GC risk were found in the other BMI categories.
In participants over 50 years of age, we observed an increased risk of GC in both
men and women with obesity, which is consistent with the results of the
preceding analysis. Furthermore, an elevated risk of GC was also identified in
women with normal BMI (18.5–22.9 kg/m2).
Gastric cancer risk according to body mass index and waist
circumference
Additional analysis considering WC was performed to account for abdominal
obesity, as BMI only reflects the height and weight of participants (Table 4). We aimed to clarify the impact of
underweight on the development of GC in those with a low WC (<90 cm for
men and <85 cm for women), as well as the impact of obesity on GC
development in the group with a high WC (≥90 cm for men and ≥85 cm
for women). Even among those with a small WC, we observed no significant
increase in GC risk among underweight men (men: HR, 1.10; 95% CI,
0.87–1.40; women: HR, 1.01; 95% CI, 0.65–1.57). However, we did
find that the risk of GC increased in the male population with severe obesity
and a WC of ≥90 cm. Furthermore, the magnitude of increased GC risk in
men with severe obesity and a high WC (HR, 1.41; 95% CI, 1.07–1.85) was
greater than that observed when WC was not considered (HR, 1.36; 95% CI,
1.12–1.74). These results suggest that obesity, particularly abdominal
obesity as opposed to simple weight gain, plays a role in elevating the risk of
GC.
Table 4.
Impact of body mass index on gastric cancer risk according to waist
circumference and sex
WC, waist circumference; BMI, body mass index; HR, hazard ratio; M,
male; F, female.
*Adjusted for age, sex, smoking status, alcohol consumption frequency
per week, history of diabetes mellitus, hypertension, and
dyslipidemia with consideration of a 2-year latency period.
†Adjusted for age, smoking status, alcohol consumption frequency per
week, history of diabetes mellitus, hypertension, and dyslipidemia
with consideration of a 2-year latency period.
‡Indicates statistical significance.
Discussion
Key results
In this study, we aimed to analyze the influence of BMI on GC risk according to
sex, based on a large-scale retrospective cohort analysis. The results indicated
that GC risk was higher in the obesity and severe obesity groups. Furthermore,
the increase in GC risk was particularly pronounced in women with obesity and
men with severe obesity. Normal BMI was also associated with increased GC risk
in women aged 50 years and older. When considering BMI and WC together, the risk
of GC was elevated in men with severe obesity and high WC.
Interpretation and comparison with previous research
Previous studies have identified a heightened risk of GC associated with
overweight or obesity, particularly concerning cardia cancer [11,19–25]. These studies
suggest that both overweight and obesity are linked to an increased risk of
cardia cancer. Consequently, the World Cancer Research Fund and the
International Agency for Research on Cancer have recognized overweight and
obesity as risk factors for cardia GC [26,27]. However, no
significant difference in the risk of non-cardia GC has been observed between
individuals with normal weight and those with obesity [11]. One proposed mechanism for the link between obesity
and cardia cancer involves the development of gastroesophageal reflux disease
(GERD) due to obesity [28,29]. Specifically, the rise in
intra-abdominal pressure caused by abdominal obesity may lead to the reflux of
gastric acid and the gastric contents, resulting in a higher incidence of GERD
among individuals with obesity [30].
Consequently, obesity could increase the risk of cardia GC through a cascade of
events, extending to GERD to Barrett esophagus and ultimately to
gastroesophageal junction adenocarcinoma, given that Barrett esophagus is
recognized as a precursor to esophagogastric junction adenocarcinoma [31,32]. Additionally, other mechanisms such as hyperinsulinemia and an
increase in insulin-like growth factors, as well as elevated levels of
adipokines (leptin and adiponectin), tumor necrosis factor-alpha, and
interleukin 6 secreted from adipose tissues, have been proposed as potential
contributors to the increased risk of GC under obese and diabetic conditions
[33,34].
Our data revealed a sex difference in the increased risk of GC, with the
difference being more pronounced in men with obesity [35]. This may be attributed to the distinct patterns of
obesity between the sexes. Typically, men exhibit a central distribution of
adipose tissue, while women tend to have a peripheral distribution, particularly
in the limbs and hips [36]. The greater
visceral adiposity found in central obesity is linked to adverse metabolic
outcomes, including increased postprandial insulin, free fatty acids, and
triglyceride levels [36]. Given that
factors secreted from adipose tissues have been proposed among potential
mechanisms for elevating GC risk, this could provide an explanation. Another
factor to consider is sex hormones. The aforementioned sex-based obesity
patterns are largely due to variations in sex hormones and their receptors. For
instance, estrogen is known to exert a protective effect against GC,
particularly the intestinal type [37].
This protective role of estrogen has been repeatedly proposed to account for the
disparity in GC risk between male and female individuals [14,38,39]. Estrogen is synthesized not only in
the gonads, but also in adipose tissue. Thus, its levels may become particularly
high in obese women, which could further explain the sex difference in GC risk
within the obese population. However, few studies have concurrently considered
BMI, sex, and the anatomical location of GC, which complicates the ability to
draw definitive conclusions. Therefore, additional research in this area is
warranted.
Another notable result of this study is the observed association between normal
weight and an increased risk of GC in women aged 50 years and older. Recent
reports have indicated a rise in GC risk among both underweight and overweight
individuals, forming a so-called “U-shaped pattern” [12,40]. While the link between overweight, obesity, and GC risk has
been described previously, it appears that being underweight or of normal weight
also increases GC risk compared to those who are overweight. To explain this
phenomenon, the authors propose two potential mechanisms. The first suggests
that precursor lesions of GC, such as atrophic gastritis or metaplasia, could
lead to malabsorption and consequently underweight [41]. This theory is supported by the fact that the
underweight group in our study was older than the other groups. The second
mechanism posits that cigarette smoking could link underweight to an increased
risk of GC [12]. Additionally, it is
worth considering that being underweight might cause gonadal dysfunction or a
decrease in estrogen levels, which could negate the protective effects of
estrogen. To date, the causal relationship or sequence of events linking
underweight or normal weight with GC risk remains unclear. Moreover, one
previous study found an association between underweight and non-cardia cancer
[12], while another study reported a
link between underweight and cardia cancer [40], indicating some inconsistencies in the findings. In conclusion,
when investigating the correlation between obesity and GC risk, it is essential
to consider not only sex but also age and the anatomical location of the
cancer.
Limitations
This study has several limitations. First, since WC data have been collected
since 2009 from the NHIS-HEALS dataset, we analyzed data with a relatively short
follow-up period compared to other observational studies. Second, we examined
all GC cases without differentiating between anatomical locations—namely,
cardia or non-cardia sites. To address these issues, we plan to conduct
long-term follow-up studies using BMI for comparison. Third, our age-specific
analysis was constrained by the small number of participants and cancer cases
under the age of 50 years, which reflects the characteristics of the NHIS-HEALS
dataset. Given the rising concern over GC in younger populations, future studies
should include datasets with a larger representation of young adults. Lastly, we
were unable to account for other GC risk factors, such as H. pylori infection
status and dietary habits, due to the inherent limitations of observational
studies. Despite these constraints, we were able to identify the risk of
developing GC associated with weight gain, while noting some sex
differences.
Conclusion
This study demonstrated a positive association between excess body weight and the
risk of GC in Koreans, indicating that the risk of GC was elevated in
individuals with obesity and severe obesity. Additionally, sex-specific
differences were observed in the impact of obesity on GC development, with men
who were severely obese and had a high WC facing a particularly increased
risk.
Authors' contributions
Project administration: Kim N
Conceptualization: Choi Y, Jang J, Kim N
Methodology & data curation: Jang J
Funding acquisition: Kim N
Writing – original draft: Choi Y
Writing – review & editing: Choi Y, Jang J, Kim N
Conflict of interest
No potential conflict of interest relevant to this article was reported.
Funding
This work was supported by the National Research Foundation of Korea (NRF) grant
funded by the Korea government (MSIT) (RS-2024-00337453).
Data availability
The data for this study has been made publicly available and the ownership of the
data belongs to the National Health Insurance Service-Health Screening Cohort
(NHIS-HEALS). Thus, the corresponding author has no authority to share this
data. Any researchers can access to this NHIS-HEALS database after submitting
and receiving approval of study proposal by NHIS review committee via the Health
Insurance Data Service home page (http://nhiss.nhis.or.kr).
Acknowledgments
Not applicable.
Supplementary materials
Not applicable.
References
1. Bray F, Ferlay J, Soerjomataram I, Siegel RL, Torre LA, Jemal A. Global cancer statistics 2018: GLOBOCAN estimates of incidence
and mortality worldwide for 36 cancers in 185 countries. CA Cancer J Clin 2018;68(6):394-424.
3. Kumar S, Metz DC, Ellenberg S, Kaplan DE, Goldberg DS. Risk factors and incidence of gastric cancer after detection of
Helicobacter pylori infection: a large cohort
study. Gastroenterology 2020;158(3):527-536.E7.
4. Shin A, Park S, Shin HR, Park EH, Park SK, Oh JK, et al. Population attributable fraction of infection-related cancers in
Korea. Ann Oncol 2011;22(6):1435-1442.
5. Tramacere I, Negri E, Pelucchi C, Bagnardi V, Rota M, Scotti L, et al. A meta-analysis on alcohol drinking and gastric cancer
risk. Ann Oncol 2012;23(1):28-36.
7. NCD Risk Factor Collaboration (NCD-RisC). Worldwide trends in body-mass index, underweight, overweight, and
obesity from 1975 to 2016: a pooled analysis of 2416 population-based
measurement studies in 128.9 million children, adolescents, and
adults. Lancet 2017;390(10113):2627-2642.
9. Renehan AG, Tyson M, Egger M, Heller RF, Zwahlen M. Body-mass index and incidence of cancer: a systematic review and
meta-analysis of prospective observational studies. Lancet 2008;371(9612):569-578.
10. Mukaisho K, Nakayama T, Hagiwara T, Hattori T, Sugihara H. Two distinct etiologies of gastric cardia adenocarcinoma:
interactions among pH, Helicobacter pylori, and bile
acids. Front Microbiol 2015;6:412
11. Chen Y, Liu L, Wang X, Wang J, Yan Z, Cheng J, et al. Body mass index and risk of gastric cancer: a meta-analysis of a
population with more than ten million from 24 prospective
studies. Cancer Epidemiol Biomarkers Prev 2013;22(8):1395-1408.
12. Jang J, Wang T, Cai H, Ye F, Murphy G, Shimazu T, et al. The U-shaped association between body mass index and gastric
cancer risk in the Helicobacter pylori biomarker cohort
consortium: a nested case-control study from eight East Asian cohort
studies. Int J Cancer 2020;147(3):777-784.
13. Lou L, Wang L, Zhang Y, Chen G, Lin L, Jin X, et al. Sex difference in incidence of gastric cancer: an international
comparative study based on the Global Burden of Disease Study
2017. BMJ Open 2020;10(1):e033323.
14. Choi Y, Kim N, Kim KW, Jo HH, Park J, Yoon H, et al. Sex-based differences in histology, staging, and prognosis among
2983 gastric cancer surgery patients. World J Gastroenterol 2022;28(9):933-947.
15. Sanikini H, Biessy C, Rinaldi S, Navionis AS, Gicquiau A, Keski-Rahkonen P, et al. Circulating hormones and risk of gastric cancer by subsite in
three cohort studies. Gastric Cancer 2023;26(6):969-987.
16. Kyoung DS, Kim HS. Understanding and utilizing claim data from the Korean National
Health Insurance Service (NHIS) and Health Insurance Review &
Assessment (HIRA) Database for Research. J Lipid Atheroscler 2022;11(2):103-110.
17. Kim MK, Han K, Lee SH. Current trends of big data research using the Korean national
health information database. Diabetes Metab J 2022;46(4):552-563.
18. Kim KK, Haam JH, Kim BT, Kim EM, Park JH, Rhee SY, et al. Evaluation and treatment of obesity and its comorbidities: 2022
update of clinical practice guidelines for obesity by the Korean Society for
the Study of Obesity. J Obes Metab Syndr 2023;32(1):1-24.
19. Samanic C, Gridley G, Chow WH, Lubin J, Hoover RN, Fraumeni JF Jr. Obesity and cancer risk among white and black United States
veterans. Cancer Causes Control 2004;15(1):35-43.
20. Lindblad M, Rodríguez LAG, Lagergren J. Body mass, tobacco and alcohol and risk of esophageal, gastric
cardia, and gastric non-cardia adenocarcinoma among men and women in a
nested case-control study. Cancer Causes Control 2005;16(3):285-294.
21. MacInnis RJ, English DR, Hopper JL, Giles GG. Body size and composition and the risk of gastric and oesophageal
adenocarcinoma. Int J Cancer 2006;118(10):2628-2631.
22. Samanic C, Chow WH, Gridley G, Jarvholm B, Fraumeni JF Jr. Relation of body mass index to cancer risk in 362,552 Swedish
men. Cancer Causes Control 2006;17(7):901-909.
23. Merry AHH, Schouten LJ, Goldbohm RA, van den Brandt PA. Body mass index, height and risk of adenocarcinoma of the
oesophagus and gastric cardia: a prospective cohort study. Gut 2007;56(11):1503-1511.
24. Corley DA, Kubo A, Zhao W. Abdominal obesity and the risk of esophageal and gastric cardia
carcinomas. Cancer Epidemiol Biomarkers Prev 2008;17(2):352-358.
25. O'Doherty MG, Freedman ND, Hollenbeck AR, Schatzkin A, Abnet CC. A prospective cohort study of obesity and risk of oesophageal and
gastric adenocarcinoma in the NIH–AARP Diet and Health
Study. Gut 2012;61(9):1261-1268.
26. Lauby-Secretan B, Scoccianti C, Loomis D, Grosse Y, Bianchini F, Straif K, et al. Body fatness and cancer: viewpoint of the IARC Working
Group. N Engl J Med 2016;375(8):794-798.
27. World Cancer Research Fund, American Institute for Cancer
Research. Diet, nutrition, physical activity and oesophageal cancer. London: World Cancer Research Fund International; 2018.
28. Derakhshan MH, Malekzadeh R, Watabe H, Yazdanbod A, Fyfe V, Kazemi A, et al. Combination of gastric atrophy, reflux symptoms and histological
subtype indicates two distinct aetiologies of gastric cardia
cancer. Gut 2008;57(3):298-305.
31. Cameron AJ, Lomboy CT, Pera M, Carpenter HA. Adenocarcinoma of the esophagogastric junction and
Barrett's esophagus. Gastroenterology 1995;109(5):1541-1546.
36. Guglielmi V, Sbraccia P. Obesity phenotypes: depot-diferences in adipose tissue and their
clinical implications. Eat Weight Disord 2018;23(1):3-14.
38. Camargo MC, Goto Y, Zabaleta J, Morgan DR, Correa P, Rabkin CS. Sex hormones, hormonal interventions, and gastric cancer risk: a
meta-analysis. Cancer Epidemiol Biomarkers Prev 2012;21(1):20-38.
39. Kim SM, Min BH, Lee J, An JY, Lee JH, Sohn TS, et al. Protective effects of female reproductive factors on Lauren
intestinal-type gastric adenocarcinoma. Yonsei Med J 2018;59(1):28-34.
40. Jo HH, Kim N, Jang J, Choi Y, Park J, Park YM, et al. Impact of body mass index on survival depending on sex in 14,688
patients with gastric cancer in a tertiary hospital in South
Korea. Gut Liver 2023;17(2):243-258.
41. Watabe H, Mitsushima T, Derakhshan MH, Yamaji Y, Okamoto M, Kawabe T, et al. Study of association between atrophic gastritis and body mass
index: a cross-sectional study in 10,197 Japanese subjects. Dig Dis Sci 2009;54(5):988-995.
Sex- and Subsite-Specific Links between Adiposity and Gastric Cancer: Beyond Body Mass Index Alone Seung-Joo Nam Gut and Liver.2026; 20(2): 161. CrossRef
Gender equity in medicine, artificial intelligence, and other
articles in this issue Sun Huh The Ewha Medical Journal.2024;[Epub] CrossRef
Effect of body mass index on gastric cancer risk according to sex in
Korea: a nationwide cohort study and literature review
Fig. 1.
Study scheme. (A) Time points for measuring body mass index (BMI)
and initiating follow-up. The orange box represents the period
during which BMI was measured in 2009–2010, with follow-up
extending until 2019. (B) Flowchart depicting the selection of study
participants. NHIS-HEALS, National Health Insurance Service-Health
Screening Cohort.
Fig. 1.
Effect of body mass index on gastric cancer risk according to sex in
Korea: a nationwide cohort study and literature review
Baseline characteristics of study participants according to body mass
index
Association between body mass index and gastric cancer risk according
to sex
BMI
(kg/m2)
Total
Male
Female
Person-years
No. of cases
HR (95% CI)*
Person-years
No. of cases
HR (95% CI)†
Person-years
No. of cases
HR (95% CI)†
2-year latency
<18.5
64,244
99
1.04 (0.85−1.28)
32,116
77
1.08 (0.85−1.36)
32,128
22
0.94 (0.60−1.45)
18.5−22.9
1,148,614
1,420
1.00 (0.93−1.08)
573,269
1,021
0.96 (0.88−1.05)
575,344
399
1.13 (0.97−1.32)
23.0−24.9
939,227
1,170
Ref
530,335
909
Ref
408,892
261
Ref
25.0−29.9
1,065,977
1,465
1.11 (1.03−1.20)‡
610,902
1,082
1.07 (0.98−1.17)
455,076
383
1.24 (1.06−1.45)‡
≥30.0
93,809
123
1.22 (1.01−1.47)‡
39,737
87
1.36 (1.12−1.74)‡
54,072
36
0.97 (0.69−1.38)
3-year latency
<18.5
64,206
84
1.06 (0.85−1.33)
32,090
67
1.13 (0.88−1.46)
32,116
17
0.86 (0.53−1.42)
18.5−22.9
1,148,125
1,219
1.01 (0.93−1.10)
572,917
876
0.97 (0.88−1.07)
575,208
343
1.14 (0.96−1.35)
23.0−24.9
938,826
1,004
Ref
530,026
781
Ref
408,800
223
Ref
25.0−29.9
1,065,447
1,247
1.10 (1.01−1.19)‡
610,487
912
1.05 (0.95−1.15)
455,961
335
1.27 (1.07−1.51)‡
≥30.0
93,767
105
1.21 (0.99−1.48)
39,714
77
1.43 (1.13−1.80)‡
54,053
28
0.89 (0.60−1.33)
4-year latency
<18.5
64,170
74
1.08 (0.85−1.37)
32,058
58
1.13 (0.87−1.49)
32,112
16
0.92 (0.55−1.54)
18.5−22.9
1,147,469
1,033
0.97 (0.89−1.06)
572,454
744
0.93 (0.84−1.04)
575,015
289
1.08 (0.90−1.30)
23.0−24.9
938,421
889
Ref
529,710
691
Ref
408,711
198
Ref
25.0−29.9
1,064,868
1,083
1.08 (0.98−1.18)
610,040
785
1.02 (0.92−1.13)
454,828
298
1.27 (1.06−1.52)‡
≥30.0
93,728
94
1.22 (0.98−1.51)
39,691
70
1.46 (1.14−1.87)‡
54,038
24
0.86 (0.56−1.32)
BMI, body mass index; HR, hazard ratio.
*Adjusted for age, sex, smoking status, alcohol consumption frequency
per week, history of diabetes mellitus, hypertension, and
dyslipidemia with consideration of a 2-year latency period.
†Adjusted for age, smoking status, alcohol consumption frequency per
week, history of diabetes mellitus, hypertension, and dyslipidemia
with consideration of a 2-year latency period.
‡Indicates statistical significance.
Association between body mass index and gastric cancer risk in an
age-stratified population
BMI
(kg/m2)
Total
Male
Female
Person-years
No. of cases
HR (95% CI)*
Person-years
No. of cases
HR (95% CI)†
Person-years
No. of cases
HR (95% CI)†
<50 years
<18.5
8,291
8
1.46 (0.7−3.00)
4,045
6
1.65 (0.72−3.80)
4,246
2
0.99 (0.23−4.22)
18.5−22.9
185,647
119
0.97 (0.74−1.27)
96,466
85
1.03 (0.76−1.41)
89,181
34
0.78 (0.46−1.33)
23.0−24.9
138,637
99
Ref
91,841
76
Ref
46,796
23
Ref
25.0−29.9
148,725
97
0.86 (0.65−1.14)
109,552
84
0.92 (0.67−1.25)
39,173
13
0.65 (0.33−1.29)
≥30.0
12,266
12
1.34 (0.73−2.45)
7,732
12
1.83 (0.99−3.37)
4,534
0
N/A
≥50 years
<18.5
55,953
91
1.02 (0.83−1.27)
28,071
71
1.06 (0.83−1.35)
27,882
20
0.93 (0.59−1.47)
18.5−22.9
962,966
1,301
1.01 (0.93−1.09)
476,803
936
0.96 (0.87−1.05)
486,163
365
1.16 (0.99−1.37)
23.0−24.9
800,590
1,071
Ref
438,494
833
Ref
362,096
238
Ref
25.0−29.9
917,252
1,368
1.13 (1.04−1.23)‡
501,349
998
1.08 (0.99−1.19)
415,903
370
1.29 (1.09−1.52)‡
≥30.0
81,543
111
1.21 (0.99-1.47)
32,005
75
1.34 (1.06−1.70)‡
49,538
36
1.05 (0.74−1.49)
BMI, body mass index; HR, hazard ratio; N/A, not applicable.
*Adjusted for age, sex, smoking status, alcohol consumption frequency
per week, history of diabetes mellitus, hypertension, and
dyslipidemia with consideration of a 2-year latency period.
†Adjusted for age, smoking status, alcohol consumption frequency per
week, history of diabetes mellitus, hypertension, and dyslipidemia
with consideration of a 2-year latency period.
‡Indicates statistical significance.
Impact of body mass index on gastric cancer risk according to waist
circumference and sex
WC (cm) by sex
BMI
(kg/m2)
Total
Male
Female
Person-year
No. of cases
HR (95% CI)*
Person-year
No. of cases
HR (95% CI)†
Person-year
No. of cases
HR (95% CI)†
<90
(M) <85 (F)
<18.5
63,692
99
1.08 (0.87−1.33)
31,940
77
1.10 (0.87−1.40)
31,752
22
1.01 (0.65−1.57)
18.5−22.9
1,120,480
1,370
1.01 (0.93−1.10)
562,289
989
0.96 (0.88−1.06)
558,192
381
1.18 (1.00−1.40)‡
23.0−24.9
809,799
963
Ref
460,118
759
Ref
349,681
204
Ref
25.0−29.9
517,213
634
1.09 (0.98−1.20)
295,048
478
1.06 (0.94−1.19)
222,166
156
1.19 (0.97−1.47)
≥30.0
5,979
5
0.85 (0.35−2.04)
2,275
3
0.85 (0.27−2.64)
3,704
2
0.89 (0.22−3.58)
≥90
(M) ≥85 (F)
<18.5
551
0
N/A
176
0
N/A
375
0
N/A
18.5−22.9
28,134
50
1.08 (0.79−1.47)
10,981
32
1.17 (0.80−1.72)
17,153
18
0.92 (0.54−1.57)
23.0−24.9
129,427
207
Ref
70,217
150
Ref
59,210
57
Ref
25.0−29.9
548,764
831
1.07 (0.92−1.25)
315,854
604
1.05 (0.88−1.26)
232,910
227
1.12 (0.83−1.49)
≥30.0
87,830
118
1.19 (0.94−1.49)
37,462
84
1.41 (1.07−1.85)‡
50,368
34
0.86 (0.59−1.33)
WC, waist circumference; BMI, body mass index; HR, hazard ratio; M,
male; F, female.
*Adjusted for age, sex, smoking status, alcohol consumption frequency
per week, history of diabetes mellitus, hypertension, and
dyslipidemia with consideration of a 2-year latency period.
†Adjusted for age, smoking status, alcohol consumption frequency per
week, history of diabetes mellitus, hypertension, and dyslipidemia
with consideration of a 2-year latency period.
‡Indicates statistical significance.
Table 1.
Baseline characteristics of study participants according to body mass
index
Table 2.
Association between body mass index and gastric cancer risk according
to sex
BMI, body mass index; HR, hazard ratio.
Adjusted for age, sex, smoking status, alcohol consumption frequency
per week, history of diabetes mellitus, hypertension, and
dyslipidemia with consideration of a 2-year latency period.
Adjusted for age, smoking status, alcohol consumption frequency per
week, history of diabetes mellitus, hypertension, and dyslipidemia
with consideration of a 2-year latency period.
Indicates statistical significance.
Table 3.
Association between body mass index and gastric cancer risk in an
age-stratified population
BMI, body mass index; HR, hazard ratio; N/A, not applicable.
Adjusted for age, sex, smoking status, alcohol consumption frequency
per week, history of diabetes mellitus, hypertension, and
dyslipidemia with consideration of a 2-year latency period.
Adjusted for age, smoking status, alcohol consumption frequency per
week, history of diabetes mellitus, hypertension, and dyslipidemia
with consideration of a 2-year latency period.
Indicates statistical significance.
Table 4.
Impact of body mass index on gastric cancer risk according to waist
circumference and sex
WC, waist circumference; BMI, body mass index; HR, hazard ratio; M,
male; F, female.
Adjusted for age, sex, smoking status, alcohol consumption frequency
per week, history of diabetes mellitus, hypertension, and
dyslipidemia with consideration of a 2-year latency period.
Adjusted for age, smoking status, alcohol consumption frequency per
week, history of diabetes mellitus, hypertension, and dyslipidemia
with consideration of a 2-year latency period.