1Advanced Biomedical Research Institute, Ewha Womans University Seoul Hospital, Seoul, Korea
2Department of Surgery, Ewha Womans University College of Medicine, Seoul, Korea
3Department of Environmental Medicine, Ewha Womans University College of Medicine, Seoul, Korea
4Institute of Ewha-SCL for Environmental Health, Ewha Womans University College of Medicine, Seoul, Korea
5Department of Human Systems Medicine, Seoul National University College of Medicine, Seoul, Korea
6Graduate Program in System Health Science and Engineering, Ewha Womans University College of Medicine, Seoul, Korea
*Corresponding author: Eunhee Ha,
Department of Environmental Medicine, Ewha Womans University College of
Medicine, 25, Magokdong-ro 2-gil, Gangseo-gu, Seoul 07804, Korea, E-mail:
eunheeha@ewha.ac.kr
*Corresponding author: Ryung-Ah Lee,
Department of Surgery, Ewha Womans University College of Medicine, 260
Gonghang-daero, Gangseo-gu, Seoul 07804, Korea, E-mail:
ralee@ewha.ac.kr
*These authors contributed equally to this work.
• Received: June 18, 2024 • Revised: July 23, 2024 • Accepted: July 23, 2024
This is an Open-Access article distributed under the terms of the
Creative Commons Attribution Non-Commercial License (http://creativecommons.org/licenses/by-nc/4.0) which permits
unrestricted non-commercial use, distribution, and reproduction in any
medium, provided the original work is properly cited.
Objectives: Interest in the association between particulate air
pollution and appendicitis risk has been increasing in recent years, and
previous studies have suggested a link between particulate matter ≤10
μm in diameter (PM10) and appendicitis. However, robust
evidence is currently lacking. This study explored the association between
short-term PM10 exposure and appendicitis using data from Ewha Womans
University Mokdong Hospital, Seoul, Korea, between January 1, 2001 and December
31, 2018.
Methods: We employed a time-stratified case-crossover design using
data from 6,526 appendicitis patients taken from the hospital’s
electronic medical records system. We analyzed the data using a conditional
logistic regression model adjusted for daily mean temperature and relative
humidity. The effect size of PM10 was estimated in terms of each 10
μm/m3 increase in PM10 concentration. Sex,
season, and age group were analyzed as subgroups.
Results: Appendicitis patients had been exposed to higher levels of
PM10 concentrations 3 days (OR 1.045, 95% CI :
1.007–1.084) and 7 days (OR, 1.053; 95% CI, 1.005–1.103) before
hospital admission. The case-crossover analysis stratified by sex, age, and
season showed that the male sex, being aged under 10, and the cold season were
associated with a significantly stronger association between appendicitis and
PM10 concentrations.
Conclusion: Our study found that PM10 concentrations were
associated with appendicitis in boys aged under 10. The cold season was also a
risk factor. Further research with a larger sample size and with other
pollutants is required to clarify the association between PM10 and
appendicitis.
Globally, acute appendicitis affects 1.17 individuals per 1,000 population
annually, with a lifetime risk of 8.6% for men and 6.7% for women [1]. In Korea, the incidence rate is 2.27 per
1,000 population [2]. Although numerous
studies have explored the pathogenetic roles of various infectious agents in
appendicitis, including viral, bacterial, fungal, and parasitic organisms, there
is still no consensus on specific causes [3]. A recent study examining the pathological evidence of
appendicitis suggests that pressure in the appendix lumen increases due to the
proliferation of intestinal bacteria following lumen obstruction and the
accumulation of secreted mucus, leading to pain around the navel [4]. However, this does not account for the
initial surge in intestinal bacteria that triggers acute appendicitis. It is
believed that this increase may be due to immunological changes or environmental
factors, rather than the onset of any specific disease state. The incidence of
appendicitis in Western countries rose from the 19th to the early 20th century
and then declined after the mid to late 20th century [5]. To explain these historical fluctuations, particulate
matter ≤10 μm in diameter (PM10) has been hypothesized
as a potential risk factor associated with an increased incidence of
appendicitis. Previous studies have also investigated the link between air
pollution and appendicitis [6,7].
PM10 is defined as fine dust composed of particles ≤10
μm in diameter and is one of the most well-known air pollutants, along
with fine particulate matter (PM2.5), sulfur dioxide
(SO2), nitrogen dioxide (NO2), ozone (O3), and
carbon monoxide (CO). Since the Korean peninsula is exposed to relatively high
levels of PM10 due to geopolitical reasons, the health effects of
PM10 on the population have become particularly apparent in
recent years [8]. Previous studies have
shown that short-term exposure to pollutants can trigger inflammatory processes,
potentially contributing to the development of appendicitis [9].
Objectives
We aimed to clarify the association between PM10 exposure and the risk
of appendicitis to provide better evidence for developing PM10
regulation policies and to alleviate the disease burden caused by
appendicitis.
Methods
Ethics statement
This study was reviewed and approved by the Ewha Womans University Mokdong
Hospital Institutional Review Board (IRB File No: SEUMC 2020-08-026). The
requirement for informed consent was waived.
Study design
We conducted a time-stratified case-crossover study design by linking the
PM10 level during the case event (the date of hospitalization) to
each appendicitis case. The study was described according to the STROBE
statement, available at https://www.strobe-statement.org/.
Setting
The electronic medical records of all patients diagnosed with acute appendicitis
and hospitalized at Ewha Womans University Mokdong Hospital over an 18-year
period were collected. Additionally, national Korean air pollution data for the
same period were gathered.
To derive time-stratified matched control events (when no admission occurred), we
selected control period dates using the same year, month, and day of the week as
the appendicitis hospitalization date, but from different weeks. These lags in
exposure were referred to as same-day exposure and exposure lagged by "n
days" before the event. The control events were matched with case events
on the same day of the week to avoid time trend bias associated with specific
weekdays.
Since this study employed a case-crossover analysis, intra-individual comparisons
were conducted without accounting for the confounding effects of other risk
factors, such as a patient's lifestyle [10]. Instead, we focused on weather variables as potential
confounding factors, including daily mean temperature and relative humidity.
Participants
We collected data from 9,886 patients treated for appendicitis at Ewha Womans
University Mokdong Hospital, a tertiary medical center in the western part of
Seoul, Korea, from January 1, 2001, to December 31, 2018. The information
gathered included registration number, gender, age, number of hospitalization
days, admission and discharge dates, and residential address. Appendicitis is
classified under the International Classification of Disease (ICD) ninth
revision (ICD-9) codes 540.9, 540.0, 540.1, or 10th revision (ICD-10) codes
K35.0, K35.1, K35.9, along with the in-hospital surgery code 470.
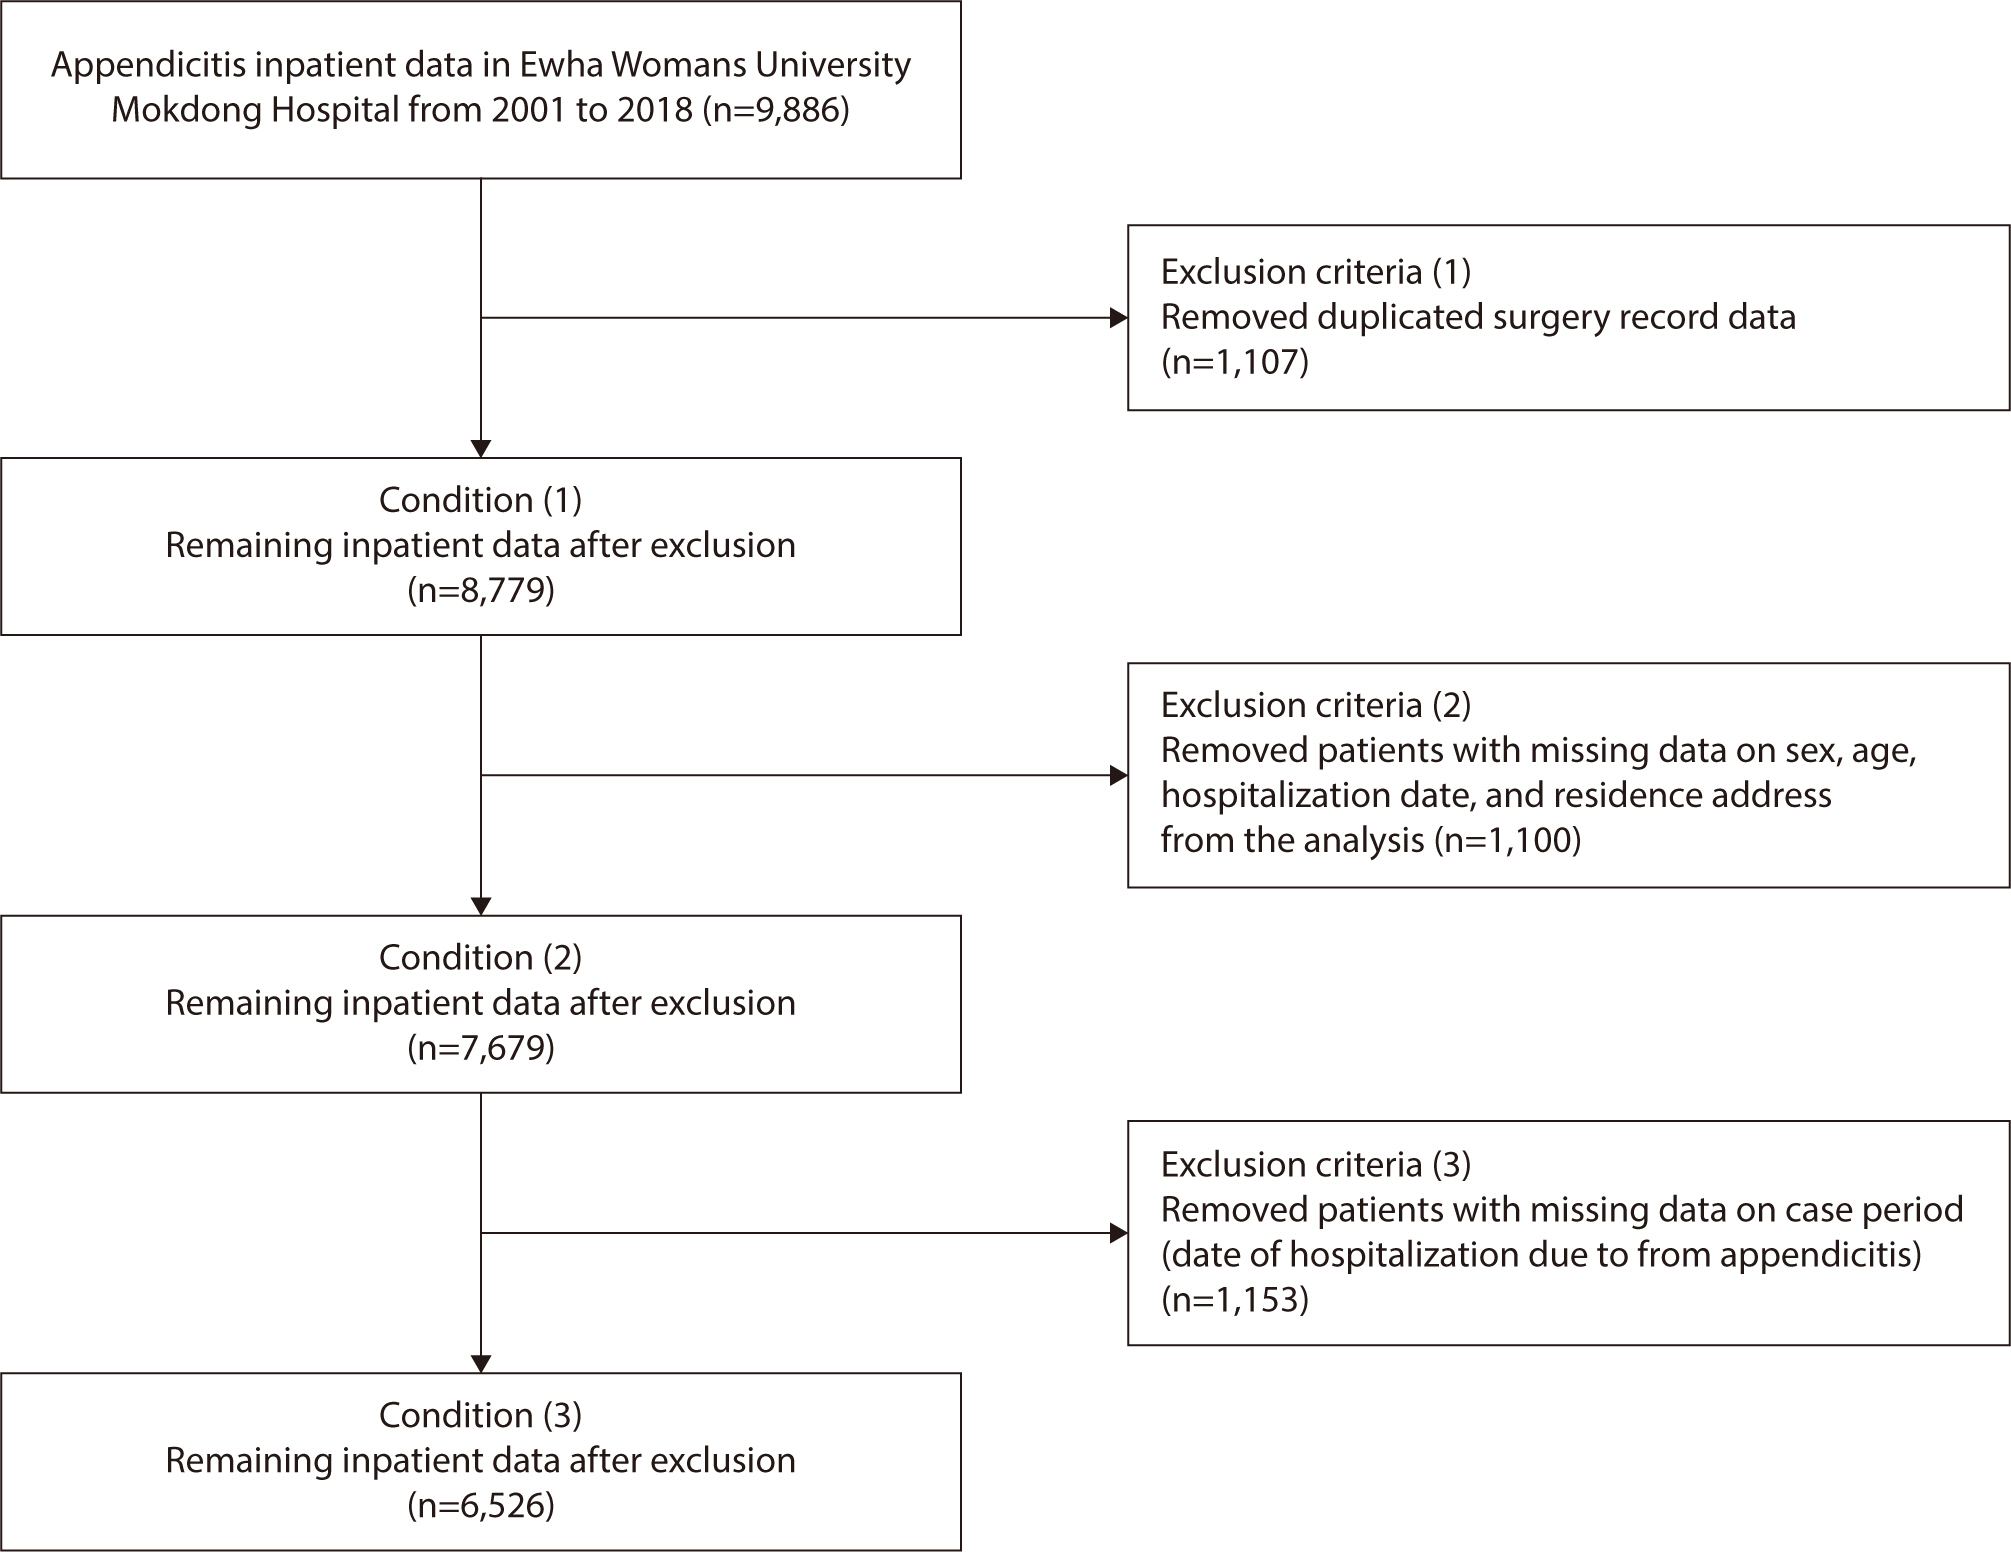
Exclusion criteria
Patients were excluded if they had two or more duplicate records of surgical
treatments or if their only surgical records were from the first visit
(n=1,107). Additionally, patients were excluded if they had missing data on
sex, age, hospitalization date, and/or address (n=1,100). Finally, those
missing data on the case period, specifically the date of hospitalization
due to appendicitis, were also excluded (n=1,153). This resulted in a total
of 6,526 patients being included in the final analysis (Fig. 1).
Fig. 1.
Identification of appendicitis cases at Ewha Womans University
Mokdong Hospital during 2001–2018.
Variables (study outcomes)
The primary outcome was the PM10 exposure level at the time of
appendicitis diagnosis.
Data sources and measurement
AirKorea (national air pollution surveillance network) database
Korea's metropolitan area spans 11,861 km² and includes Seoul,
Incheon, and Gyeonggi-do Provinces. In 2018, 133 monitoring stations were
established throughout this region. These stations are part of a national
air pollution surveillance network known as "AirKorea," which
oversees 240 measurement branches nationwide (https://www.airkorea.or.kr/). The AirKorea database records
hourly mean concentrations of air pollutants from continuous monitoring
stations, and calculates daily mean and maximum values. PM10
measurements were conducted using the beta-ray absorption method, as
detailed in previous studies [11]. We
linked the exposure data from these monitoring stations to the nearest
administrative area corresponding to each patient's residential
location. For the two-pollutant model, data were also collected on four
additional air pollutants: SO2, NO2, CO, and
O3. To assess the effect size and perform sensitivity
analysis, we gathered PM2.5 measurement data from 2015 to
2018.
Meteorological data from the Korea Meteorological Administration
Meteorological data, including the daily mean values of PM10,
temperature, and humidity, were obtained from the Korea Meteorological
Administration (http://www.kma.go.kr).
Bias
There was no selection bias reportable in this study.
Study size
Sample size estimation was not performed because this study included all target
patients who met the exclusion criteria.
Statistical methods
We analyzed the association between PM10 exposure and acute
appendicitis using conditional logistic regression (CLR), which is an expanded
logistic regression method that accounts for several control periods. This model
is particularly effective for case-crossover studies as it accommodates the
matched case and control periods within each subject. The CLR model is
beneficial in this context because it extends the logistic regression framework
to accommodate matched case-control data. This allows for the estimation of
exposure-outcome associations while considering the matching structure of the
data. Specifically, the CLR model calculates the OR for the occurrence of an
event following exposure, taking into account the individual matching factors
[10]. For each case of appendicitis,
we matched the day of the appendicitis event with four control periods at weekly
intervals, ranging from one to four weeks prior to the event. We then calculated
ORs with 95% CIs to assess the relationship between an increase in the
interquartile range of PM10 levels and the incidence of
appendicitis.
We analyzed both the single lag effects (from lag 0 to lag 14) and the
moving-average effects (from lag 0−1 to lag 0−14). Subgroup
analyses were conducted based on sex (boys/girls), season (warm season:
April‒September; cold season: October‒December), and age groups
(under 10, 10–19, 20–29, 30–39, 40–49, 50–59,
and 60 years or older). The seasonal categorization reflects the climatic
patterns typical of Korea. The selection of specific lag periods was informed by
the biological likelihood that the inflammatory response to air pollution
exposure could manifest within a few days.
We calculated Spearman’s correlation between air pollutants before
conducting the two-pollutants model. Pairs of exposure variables that
demonstrated a high correlation coefficient (greater than 0.7) were excluded
from this analysis. In the two-pollutant model, PM10 was set as the
main exposure while other air pollutants (SO2, NO2, CO,
and O3) were adjusted respectively.
When considering the delay between the actual case date and the date of
hospitalization, we calculated the PM10 concentrations on the
hospital admission day and for 7 and 14 days before admission to evaluate the
cumulative effect over several days. The ORs for temperature and humidity were
also adjusted and we included the daily average humidity and temperature as
confounding variables. The lag effect of exposure considered the moving-average
effect. The main results were for those on the The main results were for those
on the same-day, 3 day, 7 day, and 14 day moving averages. All the data
preprocessing and statistical analysis were performed using R statistical
software (Ver. 4.0.0, R Development Core Team, Vienna, Austria) and SAS 9.4 (SAS
Institute, Cary, NC, USA), and the α level for statistical significance
was 0.05.
Results
Participants’ demographic and clinical characteristics
A total of 6,526 appendicitis patients were included in the analysis after
excluding those with insufficient essential information, such as duplicated,
missing, or unmatched data (Fig. 1). The
majority of the study participants resided in Seoul, with the administrative
areas detailed in Supplement
1. Overall, 51.09% of the study subjects were male (Table 1); however, gender did not
significantly influence the risk of appendicitis (P=0.7141). Analysis of age
groups revealed that individuals aged 10–19 years (20.85%) were most
susceptible to appendicitis, while those aged 60 years and older (8.99%) were
least susceptible. Nonetheless, no significant association was found between age
and the risk of appendicitis. The number of appendicitis patients hospitalized
during the cold season (52.94%) was higher compared to those admitted in the
warm season (47.06%). However, no significant association was observed between
the season and the risk of appendicitis (P=0.7408).
Table 1.
Descriptive statistics of the epidemiological characteristics of
appendicitis patients (n=6,526) at Ewha Womans University Mokdong
Hospital during the study period (2001–2018)
Patients’ characteristics
Number of patients (%)
OR (95% CI)
P-value
Sex
Female
3,192 (48.91)
Ref.
0.7141
Male
3,334 (51.09)
1.011 (0.954−1.072)
Age, yr
Age (mean±SD)
31.93±19.08
<10
704 (11.22)
0.972 (0.853−1.106)
0.6649
10−19
1,308 (20.85)
0.992 (0.884−1.113)
0.8866
20−29
1,066 (17.00)
0.981 (0.870−1.105)
0.7473
30−39
1,189 (18.96)
1.004 (0.893−1.129)
0.9507
40−49
851 (13.57)
0.999 (0.881−1.132)
0.9828
50−60
590 (9.41)
0.999 (0.872−1.145)
0.9932
≥60
564 (8.99)
Ref.
Season
Warm season
3,071 (47.06)
Ref.
0.7408
Cold season
3,455 (52.94)
1.010 (0.953−1.071)
Levels of environmental exposure in the case and control periods
Table 2 presents the summary statistics
for the exposure data collected during the 2001–2018 study period. We
assessed the level of environmental exposure in the case and control groups
using the t-test and observed no significant difference in PM10
levels between the case and control periods. Supplement 2 contains the
summary statistics for daily air pollutant exposure levels measured throughout
the study period.
Table 2.
Summary statistics for daily exposure variables during the study
period (2001–2018)
Exposure variables
Case periods
(n=6,526)
Control periods
(n=14,539)
Mean difference
95% CI
P-value
Mean
SD
Mean
SD
PM10(μg/m3)
53.31
30.68
52.70
29.43
−0.61
(−1.48, 0.26)
0.19
Mean temperature (℃)
13.41
13.16
13.49
13.32
0.08
(−0.23, 0.38)
0.63
Mean humidity (%)
61.41
15.00
61.48
14.97
0.07
(−0.37, 0.51)
0.75
PM10, particulate matter ≤10 μm in
diameter.
Case-crossover analysis: association between PM10 exposure and the
risk of appendicitis
Table 3 summarizes the results of the
case-crossover analysis examining the association between PM10
exposure and the risk of appendicitis. The analysis found an association between
the risk of appendicitis and the average PM10 concentrations 3 days
(OR, 1.045; 95% CI, 1.007–1.084) and 7 days (OR, 1.053; 95% CI,
1.005–1.103) prior to hospital admission. However, no association was
observed with PM10 concentrations on the day of admission or 14 days
before admission.
Table 3.
Risk of appendicitis associated with increases in the interquartile
ranges of particulate matter ≤10 μm in diameter
(PM10) in various referent time intervals: a
case-crossover analysis
All models were adjusted for daily mean temperature and humidity.
*Current day: PM10 exposure level on the day of hospital
admission.
†PM10 exposure level between current hospital admission day
and two days before hospital admission (lag 0‒2).
‡PM10 exposure level between current hospital admission day
and 6 days before hospital admission (lag 0‒6).
§PM10 exposure level between current hospital admission day
and 13 days before hospital admission (lag 0‒13).
ΠThe warm season runs from April to September.
¶The cold season runs from October to March.
Sex differences: In male patients, the risk of appendicitis was
significantly associated with the mean PM10 concentrations 3 days
(OR, 1.076; 95% CI, 1.023–1.132) and 7 days (OR, 1.103; 95% CI,
1.035–1.176) prior to admission. However, no significant association was
observed in female patients at any lag time.
Age differences: Only patients under the age of 10 demonstrated
an association between the risk of appendicitis and the PM10
concentrations at the time of admission (OR, 1.129; 95% CI, 1.016–1.255),
3 days before admission (OR, 1.140; 95% CI, 1.033–1.258), and 7 days
before admission (OR, 1.235; 95% CI, 1.087–1.402).
Seasonal differences: The risk of appendicitis during the cold
season was significantly associated with the mean PM10 concentration
at various lag times, including at the time of admission (OR, 1.252; 95% CI,
1.192–1.316), three days prior (OR, 1.424; 95% CI, 1.343–1.509),
seven days prior (OR, 1.716; 95% CI, 1.593–1.849), and 14 days prior (OR,
2.632; 95% CI, 2.334–2.967). Conversely, no significant association was
found between PM10 concentration and increased appendicitis risk
during the warm season.
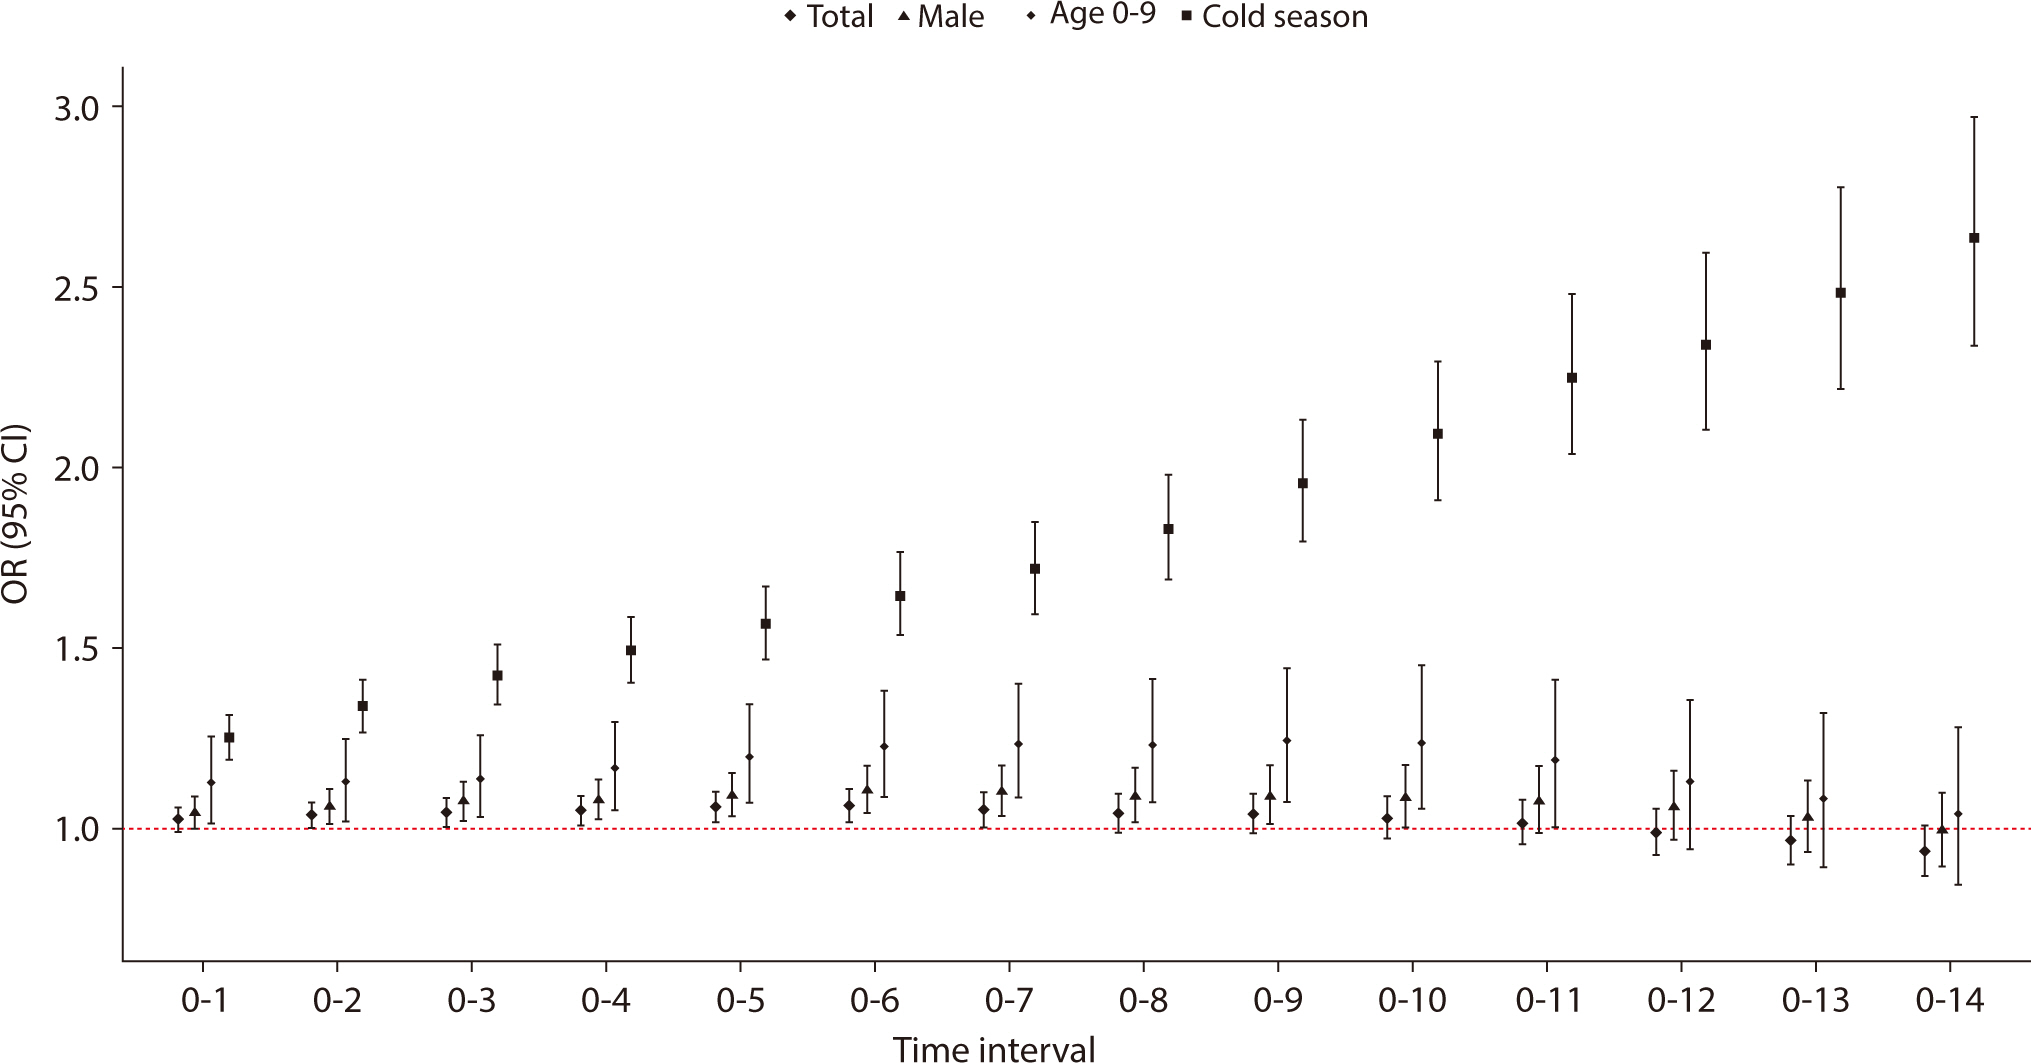
Fig. 2 depicts the risk of appendicitis
across various reference time intervals, highlighting the associated
interquartile ranges of PM10 through case-crossover analysis. This
analysis includes data from the total patient population, patients aged
0–9, males, and those observed during the cold season over various
exposure time intervals. The risk of appendicitis was linked to PM10
concentrations when the exposure period ranged from 3 to 7 days prior to
hospital admission. In subgroup analyses, a significant association was found
between the risk of appendicitis and PM10 concentrations during an
exposure interval of two to nine days for male patients and those under 10 years
of age. Additionally, during the cold season, the risk of appendicitis increased
as the exposure interval extended from 1 day to 14 days.
Fig. 2.
Risk of appendicitis during various reference time intervals with
associated interquartile ranges of PM10 using case-crossover
analysis, among total patients, patients 0–9 years of age, male
patients, and cases that occurred during the cold season.
PM10, particulate matter ≤10 μm in
diameter.
The overall risk of appendicitis during the various reference time intervals
associated with increases in the interquartile ranges of PM10,
stratified by sex, season, and age are shown in Tables 4, 5. In males, the
risk of appendicitis consistently increased over the case period from one to six
days. During the cold season, the longer the case period, the higher the risk of
appendicitis, with the greatest risk observed at a 14-day interval (OR, 2.632;
95% CI, 2.334–2.967). The correlation between PM10 and other
air pollutants is summarized in Supplement 3. Since no air pollutant demonstrated a high
correlation with PM10, no variable was excluded from the
two-pollutant model. We observed varying trends in the association between
PM10 and appendicitis across two-pollutant models. While the
association remained statistically significant when adjusted for SO2,
CO, and O3, it was attenuated upon adjustment for NO2
(Table 6). Since the AirKorea
database began recording PM2.5 measurements in 2015, we included a
sensitivity analysis to assess the impact of PM2.5 on the study
results using a two-pollutant model with both PM10 and
PM2.5, detailed in Supplement 4.
Table 4.
Overall risk of appendicitis during various referent time intervals
associated with increases in the interquartile ranges of
PM10, stratified by sex and season
All models were adjusted for daily mean temperature and humidity.
PM10, particulate matter ≤10 μm in
diameter.
*The warm season runs from April to September.
†The cold season runs from October to March.
Table 5.
Overall risk of appendicitis during various reference time intervals
associated with increases in the interquartile range of PM10,
stratified by age groups
Lag days
Age (yr)
<10
10–20
20–29
30–39
40–49
50–59
≥60
0–1
1.129 (1.016–1.255)
1.013 (0.943–1.089)
1.013 (0.936–1.096)
0.998 (0.929–1.072)
0.985 (0.891–1.088)
1.063 (0.964–1.171)
1.069 (0.946–1.207)
0–2
1.130 (1.023–1.248)
1.022 (0.949–1.100)
1.022 (0.942–1.109)
1.001 (0.921–1.087)
1.020 (0.915–1.138)
1.066 (0.954–1.190)
1.043 (0.924–1.178)
0–3
1.140 (1.033–1.258)
1.032 (0.951–1.121)
1.003 (0.921–1.093)
1.013 (0.926–1.109)
1.054 (0.937–1.184)
1.056 (0.939–1.188)
1.046 (0.914–1.198)
0–4
1.169 (1.054–1.297)
1.038 (0.953–1.129)
1.008 (0.927–1.095)
1.027 (0.936–1.126)
1.065 (0.944–1.202)
1.034 (0.920–1.162)
1.056 (0.927–1.203)
0–5
1.201 (1.074–1.342)
1.044 (0.955–1.142)
1.012 (0.927–1.106)
1.045 (0.950–1.149)
1.084 (0.955–1.232)
1.017 (0.897–1.152)
1.760 (0.938–1.234)
0–6
1.227 (1.090–1.382)
1.046 (0.948–1.153)
1.016 (0.924–1.118)
1.031 (0.928–1.145)
1.082 (0.954–1.228)
1.005 (0.879–1.148)
1.109 (0.956–1.287)
0–7
1.235 (1.087–1.402)
1.021 (0.919–1.135)
0.991 (0.891–1.101)
1.024 (0.914–1.148)
1.073 (0.936–1.231)
0.993 (0.859–1.149)
1.122 (0.955–1.318)
0–8
1.233 (1.076–1.414)
1.007 (0.899–1.128)
0.972 (0.867–1.090)
1.011 (0.897–1.141)
1.050 (0.908–1.214)
0.997 (0.853–1.165)
1.132 (0.953–1.346)
0–9
1.245 (1.074–1.444)
1.026 (0.908–1.160)
0.964 (0.853–1.090)
0.998 (0.878–1.136)
1.033 (0.886–1.206)
0.982 (0.831–1.160)
1.156 (0.961–1.391)
0–10
1.238 (1.055–1.452)
1.014 (0.890–1.155)
0.947 (0.830–1.080)
0.988 (0.861–1.134)
1.023 (0.869–1.204)
0.979 (0.819–1.170)
1.157 (0.945–1.417)
0–11
1.192 (1.005–1.414)
0.998 (0.869–1.146)
0.915 (0.797–1.050)
0.994 (0.856–1.154)
1.011 (0.848–1.204)
1.003 (0.831–1.211)
1.150 (0.925–1.429)
0–12
1.131 (0.944–1.357)
0.962 (0.831–1.112)
0.879 (0.760–1.017)
0.970 (0.829–1.134)
0.991 (0.823–1.194)
1.031 (0.844–1.259)
1.122 (0.891–1.414)
0–13
1.085 (0.892–1.320)
0.929 (0.795–1.084)
0.866 (0.740–1.013)
0.937 (0.793–1.107)
0.969 (0.798–1.177)
1.058 (0.857–1.308)
1.105 (0.864–1.415)
0–14
1.042 (0.846–1.282)
0.897 (0.762–1.056)
0.839 (0.709–0.993)
0.900 (0.753–1.075)
0.940 (0.766–1.153)
1.053 (0.841–1.319)
1.111 (0.851–1.149)
All models were adjusted for daily mean temperature and humidity.
PM10, particulate matter ≤10 μm in
diameter.
Table 6.
Risk of appendicitis during various reference time intervals
associated with increases in the interquartile range of PM10
in the two-pollutant models
Lag
Single mollutant
Two pollutant
models
PM10
Adjusted SO2
Adjusted NO2
Adjusted CO
Adjusted O3
0–1
1.027 (0.994–1.060)
1.033 (0.995–1.071)
1.005 (0.970–1.042)
1.017 (0.979–1.056)
1.017 (0.979–1.056)
0–2
1.037 (1.002–1.074)
1.041 (1.001–1.082)
1.009 (0.971–1.049)
1.029 (0.988–1.071)
1.029 (0.988–1.071)
0–3
1.045 (1.007–1.084)
1.049 (1.005–1.094)
1.011 (0.970–1.054)
1.035 (0.991–1.081)
1.035 (0.991–1.081)
0–4
1.051 (1.012–1.091)
1.049 (1.005–1.095)
1.018 (0.976–1.061)
1.043 (0.999–1.090)
1.043 (0.999–1.090)
0–5
1.061 (1.019–1.104)
1.058 (1.011–1.108)
1.030 (0.985–1.077)
1.059 (1.011–1.109)
1.059 (1.011–1.109)
0–6
1.064 (1.020–1.110)
1.060 (1.010–1.113)
1.039 (0.991–1.089)
1.067 (1.016–1.120)
1.067 (1.016–1.120)
0–7
1.053 (1.005–1.103)
1.044 (0.990–1.101)
1.032 (0.980–1.086)
1.064 (1.008–1.123)
1.064 (1.008–1.123)
0–8
1.042 (0.992–1.096)
1.029 (0.971–1.090)
1.026 (0.970–1.085)
1.066 (1.006–1.129)
1.066 (1.006–1.129)
0–9
1.042 (0.987–1.099)
1.027 (0.965–1.093)
1.032 (0.972–1.096)
1.077 (1.012–1.147)
1.077 (1.012–1.147)
0–10
1.031 (0.974–1.092)
1.002 (0.938–1.072)
1.020 (0.956–1.088)
1.062 (0.993–1.136)
1.062 (0.993–1.136)
0–11
1.017 (0.956–1.081)
0.995 (0.926–1.069)
1.012 (0.945–1.085)
1.055 (0.981–1.134)
1.055 (0.981–1.134)
0–12
0.988 (0.926–1.054)
0.962 (0.891–1.038)
0.986 (0.916–1.062)
1.029 (0.952–1.111)
1.029 (0.952–1.111)
0–13
0.966 (0.902–1.035)
0.941 (0.868–1.020)
0.975 (0.901–1.055)
1.017 (0.937–1.105)
1.017 (0.937–1.105)
0–14
0.938 (0.871–1.009)
0.913 (0.837–0.996)
0.960 (0.882–1.044)
1.003 (0.918–1.096)
1.003 (0.918–1.096)
All models were adjusted for daily mean temperature and humidity.
The present study suggests that short-term exposure to PM10 is
significantly associated with an increased risk of appendicitis in boys under
the age of 10 who were hospitalized during the cold season. To the best of our
knowledge, this study is the first to examine the impacts of PM10
exposure on acute appendicitis across diverse subgroups and various lag
intervals within the Korean population.
Interpretation
Ewha Womans University Mokdong Hospital, affiliated with Ewha Medical School,
serves as the sole community-based tertiary medical institution for a population
of 1.5 million in the Yangcheon-gu district of Seoul. Each year, the hospital
performs approximately 500 to 600 appendectomies, with the majority of these
cases being emergency surgeries for acute appendicitis. Over the 18-year study
period, about 72% of the appendicitis patients came from three neighboring
administrative districts. In terms of exposure validity, we accessed national
air pollution data from AirKorea for analysis. We then correlated this data with
our patient records, matching it to the inpatients' home addresses. As
for the validity of our outcome definition, all study participants underwent an
appendectomy following their diagnosis. This procedure followed a standardized
method for critical pathways and was verified by biopsy, ensuring the accuracy
and consistency of our outcome definitions.
Regarding sex differences, biological differences, such as variations in immune
response and hormonal influences, may make males more susceptible to
inflammatory triggers caused by air pollution. Additionally, behavioral factors,
including differences in outdoor activities and exposure levels, could
contribute to the observed disparity [12].
Children under 10 may be more vulnerable to PM10 exposure due to their
developing respiratory and immune systems, which are more susceptible to
inflammatory agents. Their higher breathing rates relative to body size and
increased time spent outdoors can lead to greater exposure to air pollutants.
Additionally, because their immune systems are not fully developed, they are
less capable of handling environmental insults such as air pollution [13]. Cold weather can exacerbate the
effects of PM10 on respiratory and immune systems, potentially
triggering inflammatory responses more readily [14].
This study observed that seasonal variations in air pollution exposure levels
significantly impacted the risk of appendicitis. Interestingly, our findings
contradict those of previous studies, which suggested that appendicitis
incidence was higher in the summer due to increased outdoor activities [15]. Our results lead us to hypothesize
that climate factors, such as temperature and humidity, play a more significant
role in increasing appendicitis risk than does outdoor activity. Additionally,
the distinct weather conditions associated with Korea's four seasons may
also influence the results observed in our study.
Our study has several key strengths and novelties. First, it specifically
targeted the Korean population. Despite Korea's relatively high air
pollution levels compared to Western countries, to our knowledge, this is the
first study utilizing Korean data to explore the relationship between
PM10 and appendicitis. Second, our methodology is distinctive as
it aimed to categorize cases across various dimensions, including age, sex, and
season. While appendicitis is recognized as an acute condition linked to
short-term effects of PM10, the critical exposure period remains
unclear. Therefore, diverging from previous research that primarily examined a
lag effect of fewer than 3 days, our study investigated the impact of
PM10 over a 14-day period prior to hospital admission.
Comparison with previous studies
In Linfen City, China, an increase of 10 μg/m3 in pollutant
levels, considering a 1-day lag, was associated with heightened health risks
from January to December 2018. Specifically, the relative risks and their 95%
CIs were as follows: PM10: 1.0179 (1.0129–1.0230),
SO2: 1.0236 (1.0184–1.0288), and NO2: 1.0979
(1.0704–1.1262). The study indicated that men and young adults aged
21–39 years were particularly susceptible to the effects of air
pollution. Furthermore, the impact of air pollutants was more pronounced during
the colder months, though the seasonal variation was not statistically
significant [16]. In Italy, factors
predicting perforated appendicitis included consultation delay (OR, 1.621; 95%
CI, 1.288–2.039; P<0.001) and the 2-day lag mean concentration of
PM10 (OR, 1.066; 95% CI, 0.007–1.130; P=0.029) during the
period from January 1 to December 31, 2014 [17]. In Taiwan, when temperatures fell below 23℃, higher
levels of PM10 were linked to a significant increase in hospital
admissions for appendicitis between 2009 and 2013 [7]. In New Zealand, no correlation was found between
PM10 levels and admissions for appendicitis from January to
December 2018 [18]. While the
above-mentioned three studies found associations between PM10 and
appendicitis admissions, other results concerning age and climate varied.
Limitations
Our study has several limitations. First, since nationwide air pollutant data are
only available by district, we could not account for variations between smaller
regional units. Consequently, we cannot ensure a precise match between the
pollution data from our database and the actual pollution levels in the
patients' neighborhoods.
Second, we did not take into account the socioeconomic and lifestyle data of the
patients; therefore, we did not categorize our patients as outdoor or indoor
workers to explore any potential association between outdoor activity and
appendicitis. However, it is important to note that appendicitis is an acute
condition, and the data were gathered from a single institution located near
where most patients reside. We assumed that the levels of air pollution exposure
were varied across different neighborhoods. Additionally, the use of a
case-crossover data analysis helped to eliminate bias from personal
confounders.
Third, since our AirKorea database only began recording PM2.5
measurements in 2015, we were unable to assess the effects of PM2.5
across all participants. Instead, we conducted a two-pollutant model analysis
using PM10 and PM2.5 data from cases recruited between
2015 and 2018. Our findings indicate that the overall effect size of
PM2.5 was greater than that of PM10, and it was
associated with smaller P-values. Therefore, further studies that focus on
PM2.5 as the primary exposure are warranted.
Suggestion for further studies
These comprehensive analyses may offer additional insights into preventive
measures for appendicitis that are typically overlooked in clinical practice.
Further research is essential to enhance our understanding of appendicitis
epidemiology and to help decrease the incidence of the condition.
Conclusion
Our study revealed a positive association between PM10 concentration
and the incidence of appendicitis, suggesting that short-term exposure to
PM10 may trigger appendicitis. The risk was notably higher in
boys under the age of 10 and during the colder seasons. However, these findings
should not be interpreted as direct evidence that PM10 directly
causes appendicitis. To further investigate these relationships, additional
ecological and large-scale epidemiological studies are necessary.
Authors' contributions
Project administration: Ha E, Lee RA
Conceptualization: Noh GT, Ha E, Lee RA
Methodology & data curation: Oh J, Noh GT
Funding acquisition: Ha E
Writing - original draft: Jee Y, Nam JH, Oh J
Writing - review & editing: Jee Y, Nam JH, Oh J, Noh GT, Ha E, Lee RA
Conflict of interest
Eunhee Ha has been a dean of the Ewha Womans University College of Medicine since
August 2021. Ryung-Ah Lee has been an associate editor of the Ewha
Medical Journal since August 2023. However, they were not involved
in the peer review process or decision-making. Otherwise, no potential conflict
of interest relevant to this article was reported.
Funding
This research was supported by a grant from the Korea Health Technology
R&D Project through the Korea Health Industry Development Institute,
funded by the Ministry of Health & Welfare, Republic of Korea (No.
HI21C1243), and a National Research Foundation of Korea grant funded by the
Korean government (Ministry of Science and ICT) (No. RS-2023-00210888). The
funders had no role in study design, data collection and analysis, decision to
publish, or preparation of the manuscript.
Data availability
Research data and R code is available upon request to the corresponding author.
Please contact them for the cooperative studies.
Supplement 1. Distribution of residential areas (administrative districts) of
appendicitis (n=6,526)
Supplement 2. Summary statistics for daily air pollutants measured at monitoring
stations during the study period of 2001–2018
Supplement 3. Spearman correlation matrix between daily air pollutants during the
study period (2001–2018)
Supplement 4. Risk of appendicitis associated with increases in the
PM10 and PM2.5 (study period: 2015-2018)
References
1. Sammalkorpi HE, Mentula P, Leppäniemi A. A new adult appendicitis score improves diagnostic accuracy of
acute appendicitis: a prospective study. BMC Gastroenterol 2014;14:114
3. Bhangu A, Søreide K, Di Saverio S, Assarsson JH, Drake FT. Acute appendicitis: modern understanding of pathogenesis,
diagnosis, and management. Lancet 2015;386(10000):1278-1287.
6. Kaplan GG, Dixon E, Panaccione R, Fong A, Chen L, Szyszkowicz M, et al. Effect of ambient air pollution on the incidence of
appendicitis. Can Med Assoc J 2009;181(9):591-597.
7. Chen CC, Yang CY. Effects of ambient air pollution exposure on frequency of
hospital admissions for appendicitis in Taipei, Taiwan. J Toxicol Environ Health A 2018;81(17):854-860.
8. Kim K, Kwak IY, Min H. Particulate matter 10 (PM10) is associated with
epistaxis in children and adults. Int J Environ Res Public Health 2021;18(9):4809
9. Kwak K, Kim JH. The association between air pollution and appendicitis: a
systematic review and meta-analysis. J Epidemiol Community Health 2017;71(12):1263-1270.
10. Maclure M. The case-crossover design: a method for studying transient
effects on the risk of acute events. Am J Epidemiol 1991;133(2):144-153.
11. Seo S, Kim J, Lee H, Jeong U, Kim W, Holben BN, et al. Estimation of PM10 concentrations over Seoul using
multiple empirical models with AERONET and MODIS data collected during the
DRAGON-Asia campaign. Atmos Chem Phys 2015;15(1):319-334.
13. Zheng P, Zhang B, Zhang K, Lv X, Wang Q, Bai X. The impact of air pollution on intestinal microbiome of asthmatic
children: a panel study. Biomed Res Int 2020;2020:5753427
14. Donaldson GC, Seemungal TA, Patel IS, Lloyd-Owen SJ, Wedzicha JA. Air pollution and other seasonal triggers of acute chronic
obstructive pulmonary disease exacerbations. Am J Respir Crit Care Med 2002;166(8):1118-1123.
15. Golz RA, Flum DR, Sanchez SE, Liu XH, Donovan C, Drake FT. Geographic association between incidence of acute appendicitis
and socioeconomic status. JAMA Surg 2020;155(4):330-338.
16. Ji Y, Su X, Zhang F, Huang Z, Zhang X, Chen Y, et al. Impacts of short-term air pollution exposure on appendicitis
admissions: evidence from one of the most polluted cities in mainland
China. Front Public Health 2023;11:1144310
17. Aroui H, Kalboussi H, El Ghali A, Kacem I, Maoua M, Maatoug J, et al. The effect of environmental factors on the incidence of
perforated appendicitis. Ann Ital Chir 2018;89(5):431-437.
18. McGowan JA, Hider PN, Chacko E, Town GI. Particulate air pollution and hospital admissions in
Christchurch, New Zealand. Aust N Z J Public Health 2002;26(1):23-29.
Global trends and inequalities in appendicitis burden among youth: Analysis of GBD 1990 to 2021 Wei Luo, Yongqing Zhao, Yuqi Liu, Xiaoliang Zhu, Shaozhen Rui Medicine.2026; 105(20): e48865. CrossRef
Unresolved policy on the new placement of 2,000 entrants at Korean
medical schools and this issue of Ewha Medical
Journal Sun Huh The Ewha Medical Journal.2024;[Epub] CrossRef
Air pollution, including PM10, as a potential risk factor
for the development of appendicitis in Korea: a case-crossover
study
Fig. 1.
Identification of appendicitis cases at Ewha Womans University
Mokdong Hospital during 2001–2018.
Fig. 2.
Risk of appendicitis during various reference time intervals with
associated interquartile ranges of PM10 using case-crossover
analysis, among total patients, patients 0–9 years of age, male
patients, and cases that occurred during the cold season.
PM10, particulate matter ≤10 μm in
diameter.
Fig. 1.
Fig. 2.
Air pollution, including PM10, as a potential risk factor
for the development of appendicitis in Korea: a case-crossover
study
Descriptive statistics of the epidemiological characteristics of
appendicitis patients (n=6,526) at Ewha Womans University Mokdong
Hospital during the study period (2001–2018)
Patients’ characteristics
Number of patients (%)
OR (95% CI)
P-value
Sex
Female
3,192 (48.91)
Ref.
0.7141
Male
3,334 (51.09)
1.011 (0.954−1.072)
Age, yr
Age (mean±SD)
31.93±19.08
<10
704 (11.22)
0.972 (0.853−1.106)
0.6649
10−19
1,308 (20.85)
0.992 (0.884−1.113)
0.8866
20−29
1,066 (17.00)
0.981 (0.870−1.105)
0.7473
30−39
1,189 (18.96)
1.004 (0.893−1.129)
0.9507
40−49
851 (13.57)
0.999 (0.881−1.132)
0.9828
50−60
590 (9.41)
0.999 (0.872−1.145)
0.9932
≥60
564 (8.99)
Ref.
Season
Warm season
3,071 (47.06)
Ref.
0.7408
Cold season
3,455 (52.94)
1.010 (0.953−1.071)
Summary statistics for daily exposure variables during the study
period (2001–2018)
Exposure variables
Case periods
(n=6,526)
Control periods
(n=14,539)
Mean difference
95% CI
P-value
Mean
SD
Mean
SD
PM10(μg/m3)
53.31
30.68
52.70
29.43
−0.61
(−1.48, 0.26)
0.19
Mean temperature (℃)
13.41
13.16
13.49
13.32
0.08
(−0.23, 0.38)
0.63
Mean humidity (%)
61.41
15.00
61.48
14.97
0.07
(−0.37, 0.51)
0.75
PM10, particulate matter ≤10 μm in
diameter.
Risk of appendicitis associated with increases in the interquartile
ranges of particulate matter ≤10 μm in diameter
(PM10) in various referent time intervals: a
case-crossover analysis
Categories
Time intervals
Admission day*
3-day moving average†
7-day moving average‡
14-day moving average§
Total
1.027 (0.994–1.060)
1.045 (1.007–1.084)
1.053 (1.005–1.103)
0.938 (0.871–1.009)
Sex
Male
1.045 (1.001–1.091)
1.076 (1.023–1.132)
1.103 (1.035–1.176)
0.994 (0.897–1.101)
Female
1.003 (0.954–1.054)
1.009 (0.954–1.066)
1.001 (0.935–1.071)
0.883 (0.795–0.981)
Age, yr
<10
1.129 (1.016–1.255)
1.140 (1.033–1.258)
1.235 (1.087–1.402)
1.042 (0.846–1.282)
10−19
1.013 (0.943–1.089)
1.032 (0.951–1.121)
1.021 (0.919–1.135)
0.897 (0.762–1.056)
20−29
1.013 (0.936–1.096)
1.003 (0.921–1.093)
0.991 (0.891–1.101)
0.839 (0.709–0.993)
30−39
0.998 (0.929–1.072)
1.013 (0.926–1.109)
1.024 (0.914–1.148)
0.900 (0.753–1.075)
40−49
0.985 (0.891–1.088)
1.054 (0.937–1.184)
1.073 (0.936–1.231)
0.940 (0.766–1.153)
50−60
1.063 (0.964–1.171)
1.056 (0.939–1.188)
0.993 (0.859–1.149)
1.053 (0.841–1.319)
≥60
1.069 (0.946–1.207)
1.046 (0.914–1.198)
1.122 (0.955–1.318)
1.111 (0.851–1.149)
Season
Warm seasonΠ
0.865 (0.817–0.916)
0.807 (0.756–0.860)
0.690 (0.637–0.746)
0.420 (0.369–0.478)
Cold season¶
1.252 (1.192–1.316)
1.424 (1.343–1.509)
1.716 (1.593–1.849)
2.632 (2.334–2.967)
All models were adjusted for daily mean temperature and humidity.
*Current day: PM10 exposure level on the day of hospital
admission.
†PM10 exposure level between current hospital admission day
and two days before hospital admission (lag 0‒2).
‡PM10 exposure level between current hospital admission day
and 6 days before hospital admission (lag 0‒6).
§PM10 exposure level between current hospital admission day
and 13 days before hospital admission (lag 0‒13).
ΠThe warm season runs from April to September.
¶The cold season runs from October to March.
Overall risk of appendicitis during various referent time intervals
associated with increases in the interquartile ranges of
PM10, stratified by sex and season
Time intervals
Total
Sex
Season
Male
Female
Warm season*
Cold season†
0–1
1.027 (0.994–1.060)
1.045 (1.001–1.091)
1.003 (0.954–1.054)
0.865 (0.817–0.916)
1.252 (1.192–1.316)
0–2
1.037 (1.002–1.074)
1.062 (1.014–1.112)
1.007 (0.956–1.061)
0.827 (0.777–0.879)
1.338 (1.268–1.412)
0–3
1.045 (1.007–1.084)
1.076 (1.023–1.132)
1.009 (0.954–1.066)
0.807 (0.756–0.860)
1.424 (1.343–1.509)
0–4
1.051 (1.012–1.091)
1.080 (1.026–1.137)
1.018 (0.963–1.076)
0.800 (0.750–0.854)
1.493 (1.405–1.586)
0–5
1.061 (1.019–1.104)
1.094 (1.036–1.155)
1.024 (0.966–1.086)
0.781 (0.730–0.836)
1.567 (1.469–1.671)
0–6
1.064 (1.020–1.110)
1.107 (1.043–1.174)
1.019 (0.957–1.084)
0.745 (0.693–0.801)
1.647 (1.536–1.765)
0–7
1.053 (1.005–1.103)
1.103 (1.035–1.176)
1.001 (0.935–1.071)
0.690 (0.637–0.746)
1.716 (1.593–1.849)
0–8
1.042 (0.992–1.096)
1.091 (1.018–1.169)
0.991 (0.921–1.066)
0.636 (0.583–0.693)
1.829 (1.688–1.981)
0–9
1.042 (0.987–1.099)
1.092 (1.015–1.176)
0.988 (0.914–1.068)
0.591 (0.538–0.648)
1.956 (1.795–2.131)
0–10
1.031 (0.974–1.092)
1.086 (1.003–1.176)
0.974 (0.897–1.059)
0.552 (0.500–0.611)
2.092 (1.908–2.294)
0–11
1.017 (0.956–1.081)
1.078 (0.990–1.174)
0.956 (0.875–1.044)
0.529 (0.475–0.588)
2.246 (2.034–2.479)
0–12
0.988 (0.926–1.054)
1.061 (0.970–1.161)
0.917 (0.836–1.006)
0.496 (0.443–0.556)
2.335 (2.102–2.594)
0–13
0.966 (0.902–1.035)
1.030 (0.936–1.135)
0.903 (0.818–0.997)
0.462 (0.409–0.522)
2.478 (2.214–2.774)
0–14
0.938 (0.871–1.009)
0.994 (0.897–1.101)
0.883 (0.795–0.981)
0.420 (0.369–0.478)
2.632 (2.334–2.967)
All models were adjusted for daily mean temperature and humidity.
PM10, particulate matter ≤10 μm in
diameter.
*The warm season runs from April to September.
†The cold season runs from October to March.
Overall risk of appendicitis during various reference time intervals
associated with increases in the interquartile range of PM10,
stratified by age groups
Lag days
Age (yr)
<10
10–20
20–29
30–39
40–49
50–59
≥60
0–1
1.129 (1.016–1.255)
1.013 (0.943–1.089)
1.013 (0.936–1.096)
0.998 (0.929–1.072)
0.985 (0.891–1.088)
1.063 (0.964–1.171)
1.069 (0.946–1.207)
0–2
1.130 (1.023–1.248)
1.022 (0.949–1.100)
1.022 (0.942–1.109)
1.001 (0.921–1.087)
1.020 (0.915–1.138)
1.066 (0.954–1.190)
1.043 (0.924–1.178)
0–3
1.140 (1.033–1.258)
1.032 (0.951–1.121)
1.003 (0.921–1.093)
1.013 (0.926–1.109)
1.054 (0.937–1.184)
1.056 (0.939–1.188)
1.046 (0.914–1.198)
0–4
1.169 (1.054–1.297)
1.038 (0.953–1.129)
1.008 (0.927–1.095)
1.027 (0.936–1.126)
1.065 (0.944–1.202)
1.034 (0.920–1.162)
1.056 (0.927–1.203)
0–5
1.201 (1.074–1.342)
1.044 (0.955–1.142)
1.012 (0.927–1.106)
1.045 (0.950–1.149)
1.084 (0.955–1.232)
1.017 (0.897–1.152)
1.760 (0.938–1.234)
0–6
1.227 (1.090–1.382)
1.046 (0.948–1.153)
1.016 (0.924–1.118)
1.031 (0.928–1.145)
1.082 (0.954–1.228)
1.005 (0.879–1.148)
1.109 (0.956–1.287)
0–7
1.235 (1.087–1.402)
1.021 (0.919–1.135)
0.991 (0.891–1.101)
1.024 (0.914–1.148)
1.073 (0.936–1.231)
0.993 (0.859–1.149)
1.122 (0.955–1.318)
0–8
1.233 (1.076–1.414)
1.007 (0.899–1.128)
0.972 (0.867–1.090)
1.011 (0.897–1.141)
1.050 (0.908–1.214)
0.997 (0.853–1.165)
1.132 (0.953–1.346)
0–9
1.245 (1.074–1.444)
1.026 (0.908–1.160)
0.964 (0.853–1.090)
0.998 (0.878–1.136)
1.033 (0.886–1.206)
0.982 (0.831–1.160)
1.156 (0.961–1.391)
0–10
1.238 (1.055–1.452)
1.014 (0.890–1.155)
0.947 (0.830–1.080)
0.988 (0.861–1.134)
1.023 (0.869–1.204)
0.979 (0.819–1.170)
1.157 (0.945–1.417)
0–11
1.192 (1.005–1.414)
0.998 (0.869–1.146)
0.915 (0.797–1.050)
0.994 (0.856–1.154)
1.011 (0.848–1.204)
1.003 (0.831–1.211)
1.150 (0.925–1.429)
0–12
1.131 (0.944–1.357)
0.962 (0.831–1.112)
0.879 (0.760–1.017)
0.970 (0.829–1.134)
0.991 (0.823–1.194)
1.031 (0.844–1.259)
1.122 (0.891–1.414)
0–13
1.085 (0.892–1.320)
0.929 (0.795–1.084)
0.866 (0.740–1.013)
0.937 (0.793–1.107)
0.969 (0.798–1.177)
1.058 (0.857–1.308)
1.105 (0.864–1.415)
0–14
1.042 (0.846–1.282)
0.897 (0.762–1.056)
0.839 (0.709–0.993)
0.900 (0.753–1.075)
0.940 (0.766–1.153)
1.053 (0.841–1.319)
1.111 (0.851–1.149)
All models were adjusted for daily mean temperature and humidity.
PM10, particulate matter ≤10 μm in
diameter.
Risk of appendicitis during various reference time intervals
associated with increases in the interquartile range of PM10
in the two-pollutant models
Lag
Single mollutant
Two pollutant
models
PM10
Adjusted SO2
Adjusted NO2
Adjusted CO
Adjusted O3
0–1
1.027 (0.994–1.060)
1.033 (0.995–1.071)
1.005 (0.970–1.042)
1.017 (0.979–1.056)
1.017 (0.979–1.056)
0–2
1.037 (1.002–1.074)
1.041 (1.001–1.082)
1.009 (0.971–1.049)
1.029 (0.988–1.071)
1.029 (0.988–1.071)
0–3
1.045 (1.007–1.084)
1.049 (1.005–1.094)
1.011 (0.970–1.054)
1.035 (0.991–1.081)
1.035 (0.991–1.081)
0–4
1.051 (1.012–1.091)
1.049 (1.005–1.095)
1.018 (0.976–1.061)
1.043 (0.999–1.090)
1.043 (0.999–1.090)
0–5
1.061 (1.019–1.104)
1.058 (1.011–1.108)
1.030 (0.985–1.077)
1.059 (1.011–1.109)
1.059 (1.011–1.109)
0–6
1.064 (1.020–1.110)
1.060 (1.010–1.113)
1.039 (0.991–1.089)
1.067 (1.016–1.120)
1.067 (1.016–1.120)
0–7
1.053 (1.005–1.103)
1.044 (0.990–1.101)
1.032 (0.980–1.086)
1.064 (1.008–1.123)
1.064 (1.008–1.123)
0–8
1.042 (0.992–1.096)
1.029 (0.971–1.090)
1.026 (0.970–1.085)
1.066 (1.006–1.129)
1.066 (1.006–1.129)
0–9
1.042 (0.987–1.099)
1.027 (0.965–1.093)
1.032 (0.972–1.096)
1.077 (1.012–1.147)
1.077 (1.012–1.147)
0–10
1.031 (0.974–1.092)
1.002 (0.938–1.072)
1.020 (0.956–1.088)
1.062 (0.993–1.136)
1.062 (0.993–1.136)
0–11
1.017 (0.956–1.081)
0.995 (0.926–1.069)
1.012 (0.945–1.085)
1.055 (0.981–1.134)
1.055 (0.981–1.134)
0–12
0.988 (0.926–1.054)
0.962 (0.891–1.038)
0.986 (0.916–1.062)
1.029 (0.952–1.111)
1.029 (0.952–1.111)
0–13
0.966 (0.902–1.035)
0.941 (0.868–1.020)
0.975 (0.901–1.055)
1.017 (0.937–1.105)
1.017 (0.937–1.105)
0–14
0.938 (0.871–1.009)
0.913 (0.837–0.996)
0.960 (0.882–1.044)
1.003 (0.918–1.096)
1.003 (0.918–1.096)
All models were adjusted for daily mean temperature and humidity.
Table 1.
Descriptive statistics of the epidemiological characteristics of
appendicitis patients (n=6,526) at Ewha Womans University Mokdong
Hospital during the study period (2001–2018)
Table 2.
Summary statistics for daily exposure variables during the study
period (2001–2018)
PM10, particulate matter ≤10 μm in
diameter.
Table 3.
Risk of appendicitis associated with increases in the interquartile
ranges of particulate matter ≤10 μm in diameter
(PM10) in various referent time intervals: a
case-crossover analysis
All models were adjusted for daily mean temperature and humidity.
Current day: PM10 exposure level on the day of hospital
admission.
PM10 exposure level between current hospital admission day
and two days before hospital admission (lag 0‒2).
PM10 exposure level between current hospital admission day
and 6 days before hospital admission (lag 0‒6).
PM10 exposure level between current hospital admission day
and 13 days before hospital admission (lag 0‒13).
The warm season runs from April to September.
The cold season runs from October to March.
Table 4.
Overall risk of appendicitis during various referent time intervals
associated with increases in the interquartile ranges of
PM10, stratified by sex and season
All models were adjusted for daily mean temperature and humidity.
PM10, particulate matter ≤10 μm in
diameter.
The warm season runs from April to September.
The cold season runs from October to March.
Table 5.
Overall risk of appendicitis during various reference time intervals
associated with increases in the interquartile range of PM10,
stratified by age groups
All models were adjusted for daily mean temperature and humidity.
PM10, particulate matter ≤10 μm in
diameter.
Table 6.
Risk of appendicitis during various reference time intervals
associated with increases in the interquartile range of PM10
in the two-pollutant models
All models were adjusted for daily mean temperature and humidity.